Introducing
Conditional Probability
Mary
Lynn is a senior at her school.
After her three years of observing, she thinks that girls with blond
hair are more likely to be shorter than girls with brown hair. She decides to do a project, and sample
40 girls to find out. She uses a
random sample to get 25 girls with blond hair and 25 with brown hair. She defines “tall” as being 5’9”, and
obtains each girl’s height. Her
findings are in the contingency table below.
|
|
Shorter than 5’9” |
5’9” or Taller |
Total |
|
Blond
|
22 |
3 |
25 |
|
Brown |
14 |
11 |
25 |
|
Total |
36 |
14 |
50 |
A
way to represent the 4 different possibilities of hair color and height is to
use a tree diagram. This shows us
the different ways the outcomes could occur, such as choosing a girl with blond
hair who is shorter than 5’9”.
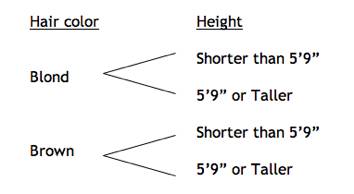
This
tree diagram helps us see what the possible outcomes are when observing a
particular girl in the sample.
First, her hair is either blond or brown, and then we consider her
height.
Conditional
probability has to do with the question, “Given that a certain thing happens,
what is the probability that something else happens in addition to that?”
The
following questions explore conditional probabilities in this situation.
What
percent of girls in the study were 5’9” or taller?
14/50 = .28 x 100 = 28 %
Shorter
than 5’9”?
36/50 = .72 x 100 = 72 %
Of
the girls with blond hair, what percent were shorter than 5’9”?
|
|
Shorter than 5’9” |
5’9” or Taller |
Total |
|
Blond
|
22 |
3 |
25 |
|
Brown |
14 |
11 |
25 |
|
Total |
36 |
14 |
50 |
First
we look at the whole row of girls with blond hair; this is the total number of
girls we are looking at right now (25). Next we look in the column for girls
shorter than 5’9”. They intersect
in the cell with value 22. So 22
out of 25 girls with blond hair were shorter than 5’9”. What percentage is this?
22/25 = .88 x 100 = 88 %
What
percent were 5’9” or taller?
We
do the same thing now, but we look at the 5’9” or taller column, which
intersects the “blond” row at 3.
So 3 out of 25 girls with blond hair were 5’9” or taller. Find the percentage:
3/25 = .12 x 100 = 12 %
So
obviously, the majority of the girls who had blond hair were shorter than
5’9”.
Out
of the girls who were 5’9” or taller, what percent of them had brown hair?
|
|
Shorter than 5’9” |
5’9” or Taller |
Total |
|
Blond
|
22 |
3 |
25 |
|
Brown |
14 |
11 |
25 |
|
Total |
36 |
14 |
50 |
So
we look at the 5’9” or taller column, and that is the total number we are
working with (14). Then we look at
the brown hair row, and these two intersect at the cell with value 11.
So
11 out of 14 girls taller than 5’9” had brown hair. What percentage is this?
11/14 = .786 x 100 = 78.6 %
What
was Mary Lynn ultimately trying to determine? She wanted to know if there was any association between hair
color and height, i.e. she wanted to know if hair color and height are
independent or dependent. Two
events are independent if there is no association between them, i.e. if their
conditional probabilities are equal to the marginal probabilities. A marginal probability is the
probability obtained by taking the total number of one variable divided by the
total number of items in the survey.
Here’s what that would look like in our example:
We
had an even split for hair color: 50% of the girls had blond hair, and 50% had
brown hair. If height were
independent from hair color, then we should have approximately 50% of the girls
for each hair color shorter than 5’9”, and about 50% taller than 5’9”. So the proportions we get by taking the
totals in the margins should be equal (marginal proportions). If the marginal proportions were equal,
we would see something more like this:
|
|
Shorter than 5’9” |
5’9” or Taller |
Total |
|
Blond
|
12 |
13 |
25 |
|
Brown |
14 |
11 |
25 |
|
Total |
26 |
24 |
50 |
As
we see in the above contingency table and calculations, if hair color and
height were not associated, the proportion of girls who have blond hair should
be equal to the even proportion in the right margin.
So
are hair color and height independent?
Let’s look back at the proportions we calculated earlier:
What
percent of girls in the study were 5’9” or taller?
14/50 = .28 x 100 = 28 %
Shorter
than 5’9”?
36/50 = .72 x 100 = 72 %
Since
.28 and .72 are not at all close to .50, we see that there is a difference
between the marginal proportions.
This information could definitely lead us to suspect that there is some
kind of association between hair color and height.
Additional
Activity: “To Replace or Not to
Replace?”
This activity allows
students to use their graphing calculators to explore the scenarios of drawing
marbles out of a bag, first replacing each marble after a draw, and then not
replacing each marble. How does
this affect the probability? This
exploration will help students to understand even more about conditional
probability and independent/dependent events.
More
Applications of Conditional Probability
·
Sampling
with/without replacement: This is the concept dealt with in the TI
activity. When drawing marbles
from a bag, cards from a deck, or people out of a group, you can either replace
each selection before drawing again, or not replace it. The probabilities will turn out
differently if you replace vs. not replacing. If there are 3 red marbles in a bag of 5 marbles, the
probability of drawing a red will be 3/5 each time if you replace, but it will
decrease each time you draw a red marble if you do not replace it.
·
Diagnostic
testing: A common application
of conditional probability is testing for drugs or diseases. When a test like this is given, the
person being tested receives either a positive or negative test result, and
either does or does not have the disease (or use the drugs). Many questions can be asked, such as:
- What is the probability you have the
disease if you get a
positive test result? (Given that you receive a positive test result, what is
the probability you have the disease?
i.e. what is P(disease|positive)?)
-
What
is the probability you will get a negative test result if you have the
disease? (Given that you have the disease,
what is the probability you will receive a negative test result? i.e. what is P(negative|disease)?)
-
What
is the probability a person will test positive for using drugs if he/she does
not actually use them?
(Given
that a person does not use drugs, what is the probability they will receive a
positive test result? i.e. what is
P(positive|not drug user)?)
These last two questions deal with the concepts of
false positive and false negative.
A false negative occurs when a test result comes back negative, but it
is false, i.e. a person actually does have that which he or she is being tested for. A false positive is the opposite: a
person receives a positive test result when he or she actually does not have what he or she is
being tested for. This concept
relies heavily on conditional probability, and will be explored more in the
next day’s lesson.