
Polar
Equations
by
Diana May
Investigation #11 ~ We will investigate
the impact of varying constants in various polar equations.
First, let’s look at what happens when we change
the constants a
and k
for
r = 2a*sin(kx):
Let’s
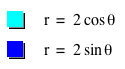
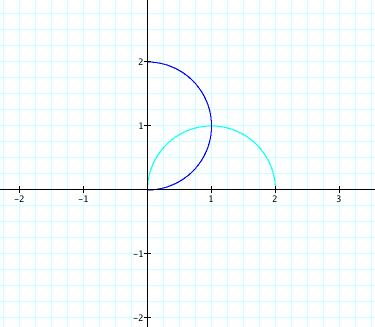
look at the basic graph r = 2*sin(x) for x ranging from 0 to π/2 and π,
respectively:
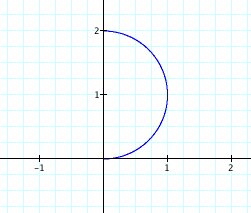
It appears as though the curve starts at (0,0)
and completes a cycle when x ranges from 0 to π. We get a unit circle centered at (0,1).
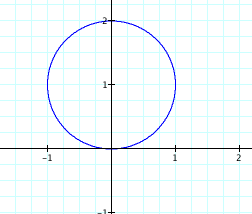
Now,
let’s change the values of a:
This seems to give us a circle with radius abs(a), centered at (0, a).
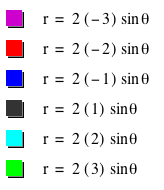
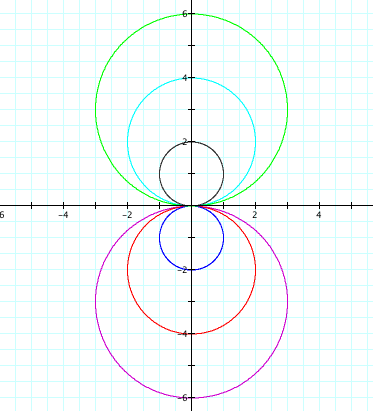
Now, let’s keep a equal to 1 and let k vary. To see how the graph changes as k varies from -5 to 5,
click HERE.
The next equation we’re
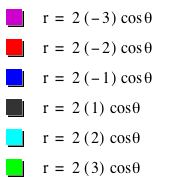
going to consider is r = 2a*cos(kx).
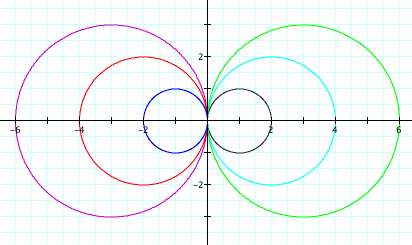
For a movie on varying k from –5 to 5, click HERE.
At first, it appears that this is simply
a 90-degree clockwise rotation of the graph, but upon further inspection, we
see this is not the case. If we
graph the following equations from x = 0 to π/2, you can observe that the two
graphs do not line up after a rotation.
Now, let’s see what happens if we add a constant
to the two previously discussed equations.
How
would we expect r = 2cos(x) + 1 to be different from r = 2cos(x)? Since we’re adding 1 to the radius, we
would expect the radius to increase by 1 unit. So, if we drew a line from the origin to the point on our r
= 2cos(x) graph, we should be able to continue along that line for one unit and
find the corresponding point on r = 2cos(x)+1.
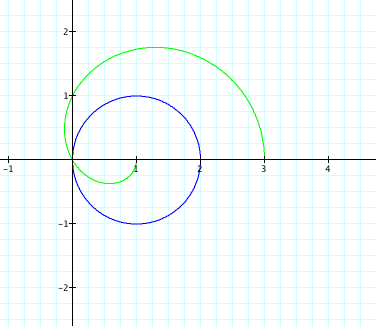
This is exactly what we expected. Look at where x = 0. The first graph is at (2,0) and the
second is at (3,0). Also, when the
cosine values become negative (x = π /2),
the radius of the second graph seems to be smaller, but it is actually less
negative. The second graph begins
to form an inner loop once r = 2cosx+ 1 = 0. For a movie on how r = 2cosx + b changes as b changes, click HERE. If we were to let x continue to 2π, we’d get the following
graph:
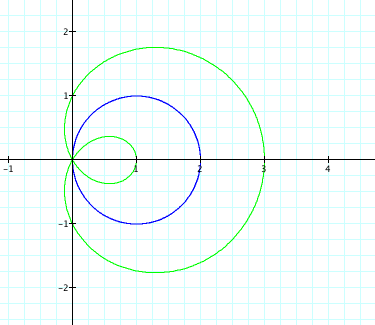
A similar pattern is seen for r = 2sinx + b. For a movie on r = 2sinx + b as b changes, click HERE.
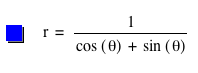
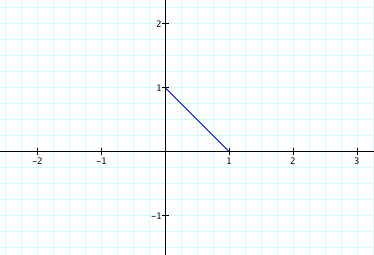
Now, let’s investigate the equation r = c/[acos(kx)+bsin(kx)]
We’ll start by looking at the graph for the basic equation and let x range from 0 to π/2:
Now, let’s see what happens if we let x range
from 0 to π:
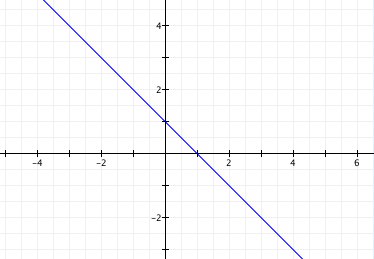
Does this line extend in both directions to
infinity? Let’s look at what is
happening with the equation.
Notice that the radius will be undefined when the denominator is 0,
which is when acos(x)
= bsin(x). In our first case, that will be when
cos(x) = sin(x), which is when x = 3π/4
(+ multiplies of p). What happens to r when x approaches
3π/4? Let’s look at y = cos(x) and y = sin(x):
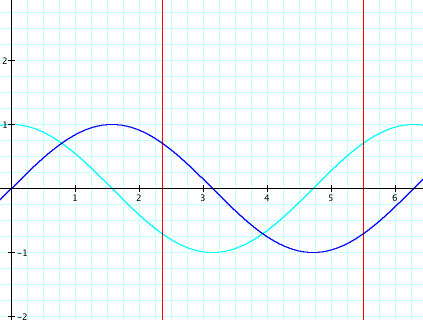
The red lines indicate where x = 3π/4 and
7π/4. So, we can see that the sum of cos x and sin x is positive and approaches
0 as x approaches 3π/4 from the left.
From the right, the sum is negative and approaches 0. Since cos x + sin x is in the
denominator, r approaches positive infinity as x approaches 3π/4 from the left
and negative infinity as x approaches 3π/4 from the right. A similar trend occurs as x approaches 7π/4.
The original polar equation was equivalent to
the linear equation y = -x + 1.
Let’s see what happens to the line if we change some of the
constants. We’ll start with
varying the c
constant.
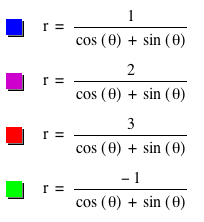
When we change c, we are simply changing the coefficient of r, which changes the y-intercept of our linear equation. This makes sense because multiplying both sides of the equation by c causes the radius to be c times larger.
What happens when we vary a?
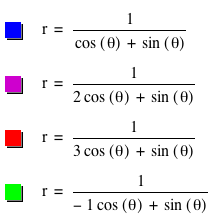
The coefficient on the cosine term seems to
change the slope of the line. It
seems that multiplying the cosine term by a causes the slope to
increase by a factor of a.
What happens if we vary
the coefficient on the sine term?
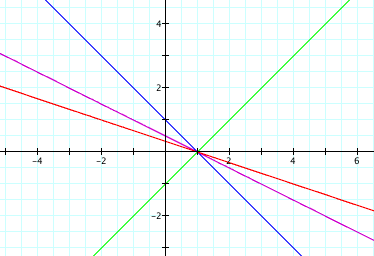
This also seems to affect the slope, but now it
causes the slope to change by a factor of 1/b. As x increase by 1, y increases by 1/b.
Questions? E-mail me.