
The constant b
Assignment 2 - Diana May
In the generic quadratic equation, y
= ax2 +bx +c, the values of a, b, and c all impact the graph of the
function. In this problem, we will
investigate the impact b has on the graph.
When first beginning this
exploration, I graphed a few different functions that had the same a and c
values, with varying b values. My
first graph was rather misleading:
From looking at this graph, I
thought that b played a role in not only the location of the parabola, but also
the size of the parabola, since the graphs seemed to get larger as b increased.
I then decided on a more symmetric
approach for selecting my b values and graphed the following functions:
The
functions being graphed here are y = x2 +nx+1, with n = -3, -2, -1,
0, 1, 2, 3.
It may not be as easy to see the individual graphs, but it is clear, especially from the yellow and grey graphs, that changing the b value did not change the size of the parabola, only the location.
But how does it affect the
location? To clear up the number
of graphs, I made a movie demonstrating the n value ranging from –7 to 7. Click here for the movie.
From this movie, we can see that the
minimum of the parabola follows along another parabola, in this case, the
parabola is y = -x2+1.
To
understand where this is coming from, let’s look at the quadratic formula:
From
the quadratic formula, we know that the minimum (or maximum) occurs at
x = -b/2a
and if we plug that into our function, we get:

Let’s see if we can find the
parabola that the minimums (or maximums) would follow for any quadratic:
Again,
we want to plug in x = -b/2a, but our function is now y = ax2+bx+c:
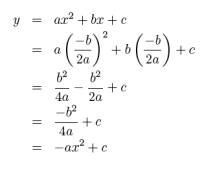
Now we have seen that the parabola’s location is affected by b and as b changes, the minimum (or maximum) can be located on a parabola determined by a and c.
Questions? E-mail
me.