
The Investigation of the Linear Function
By
Ronnachai
Panapoi
In this write-up
assignment, I will discuss on the graph of function which is formed by the
different types of two linear functions.
Let f(x) and g(x) be
linear functions given by
f(x) = ax
+ b
g(x) = cx + d
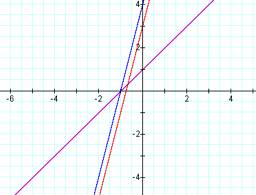
Firstly, I will
explore the graph of h(x) defined as
h(x) = f(x) + g(x)
In this case, we
surely know that h(x) is still the linear function since h(x) is in the form of
(a + c)x + (b+d).
After that, I
investigate how the h(x) changes when each constant varies. By adjusting the
constant with the four sliders, we have seen the changes of the graph, h(x).
Click HERE to investigate the characteristics of
graph of h(x)
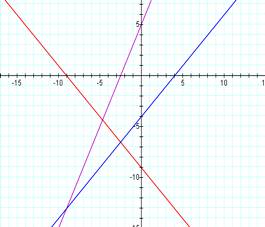
In the case of h(x)
= f(x) + g(x), we know that slope of the graph of h(x) is (a + c). So, as the a, or c
changes, the slope of h(x) also changes at the same time.
In addition, the
y-intercept of h(x) changes when the y-intercepts of f(x) and g(x) vary. We can
investigate again to make sure about this notion by clicking HERE.
Secondly, we will
study another type of h(x) defined as
h(x) = f(x)![]() g(x) for different types of the linear functions, f(x) and g(x).
g(x) for different types of the linear functions, f(x) and g(x).
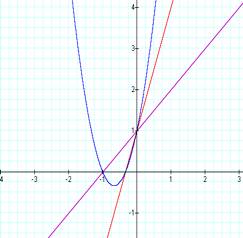
In this case, we
know that the graph of h(x) is a parabola as a result of the product of two
linear functions, f(x) and g(x), which is a quadratic equation.
I will investigate how
each constant affects to the characteristics of h(x) by replacing different
constant into the equation. Click HERE to see the
change of h(x) after the constants are adjusted.
While exploring, I
have seen that the parabola (h(x)) has the lowest point when both values of a,
c are positive and negative at the same time. By contrast, the h(x) has the highest point when a, c are not
positive or negative at the same time.
Click HERE to see whether or not
what I have investigated is true.
Further, if only the
value of b changes, I have discovered that h(x) moves up and down. Click HERE to see the picture.
The graph of h(x)
moves up and down around the x-intercept point of g(x). Particularly, the path
of the vertex of h(x) looks like the parabola.
Next, I will talk
about what I have found as investigating h(x) in the form of h(x) = f(x)/g(x)
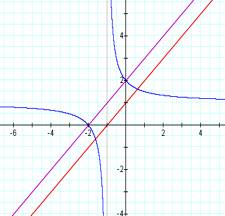
I have seen that the
graph of h(x) in this case is the disconnected curve.
Click HERE to see the graph of h(x) with various
constants in f(x) and g(x).
Noticeably, the
graph of h(x) intersects the x-axis and
y-axis at the points of which
the graph of f(x) intersects x-axis and y-axis.
Looking at the graph
of h(x), one of the curves goes from the left-hand side close to the line: y
= a and moves down near the line: x = -d/c.
The other curve goes
from the right-hand side closely-above the line: y = a and then move up near
the line: x = -d/c.
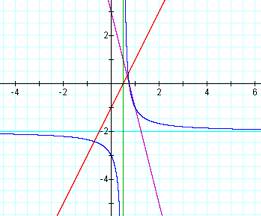
The criteria to make
a decision when the graph of h(x) will move up at the left or the right depends
on the intersection point of f(x) and g(x). The graph of h(x) will move up at
the left if the intersection point of f(x) and g(x) is on the left side of the
line: x = -d/c. Similarly, the graph of h(x) will move
up at the right if the intersection point of f(x) and g(x) is on the right side
of the line: x = -d/c.
Click HERE to see the picture about this idea.
Finally, we will
explore and summarize what we have seen of the graph of h(x) defined by h(x) =
f(g(x)).
Let investigate the
graph of h(x) first by clicking HERE.
Of course, we know
that h(x) is still the linear function.
This is because
h(x) = f(g(x))
= f(cx + d) = a (cx + d) + d = (ac)x + d
Although, the graph
of h(x) is the linear which we know very well about its y-intercept point and
its slope by looking at d and ac, respectively, there remains some interesting
point in this case.
As exploring, it is
noticeable that sometimes the graph of h(x) is parallel to f(x) or g(x).
Click HERE to look for when do these events occur?
What have you seen
as you explore the graph of h(x)?
Some facts I have got from
exploring the graph are as follows:
1. When the product
of a and c is prime, the graph of h(x) is parallel to one of the
two graphs, f(x) and g(x).
This suggests that
one of these graphs has slope equal to1 and the other is the prime.
I, therefore, obtain
the first fact that the graph of h(x) is parallel to f(x) or g(x) if it has the
slope as a prime.
2. Apparently, these
three graphs will be parallel to each other if their slopes are equal to 1.