


In this assignment, we have studied on the polar
equation. This is a good chance for making connection between the rectangular
coordinates ![]() and the polar
coordinates
and the polar
coordinates![]() . In some sense, the polar equation is more convenient to
locate a point. In the discussion on polar coordinates, we still start with the
. In some sense, the polar equation is more convenient to
locate a point. In the discussion on polar coordinates, we still start with the
![]() -coordinate system. But we use the origin as the pole and the
non-negative
-coordinate system. But we use the origin as the pole and the
non-negative ![]() -axis as the polar axis. By defining for the polar
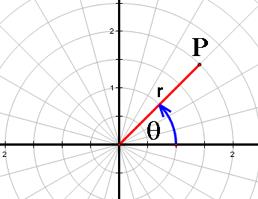
coordinates, we have the point P with polar coordinates
-axis as the polar axis. By defining for the polar
coordinates, we have the point P with polar coordinates ![]() written as
written as ![]() .
.
To locate the point P, we begin with finding the
terminal side of the angle ![]() in radians. From
the positive
in radians. From
the positive ![]() -axis as its initial side, the angle is measured
counterclockwise if it is positive.
-axis as its initial side, the angle is measured
counterclockwise if it is positive.
If ![]() , the point P is on the terminal side with distance
, the point P is on the terminal side with distance ![]() from the origin.
from the origin.
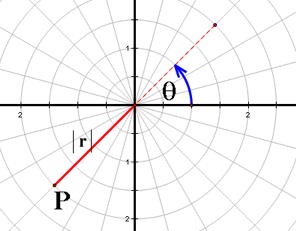
If ![]() < 0, the point P is on the opposite ray of the terminal
side with the distance
< 0, the point P is on the opposite ray of the terminal
side with the distance ![]()
Some different sense between the rectangular and polar
coordinates is the point in polar coordinates has more than one representation
in polar coordinates.
We will explore the following equation in the polar
coordinates.
for
![]()
Click HERE
to explore the above equations by using the Graphing Calculator 3.5 as a tool.
Discussion
I
will start for the case of k = 1 and
p = 1 and p = -1, respectively.
The graphs of 4 different polar equations are the
parabolas.
From the exploration, we will see that the absolute
values of p determine the width of
the parabolas. In other words, the more the absolute value of p, the wider the expansion of the parabola in each
equation.
Also, to determine the direction in expanding of a
parabola, we look at the form of the polar equation.
If the polar equations are in the form of cosine, they
are the horizontal parabolas expanded vertically according to the absolute
value of p. By contrast, if they
are in form of sine, they are the vertical parabolas expanded horizontally
relying on the absolute value of p
as well. From this point, we can
also observe the sign of p
(positive or negative) determine the directrix of the parabola.
Next,
consider for ![]() . The figures below show the graph of ellipses for k = 0.9 and p = 2 and p = -2 respectively.
. The figures below show the graph of ellipses for k = 0.9 and p = 2 and p = -2 respectively.
Click
HERE for the investigation in gcf file.
In
this case, we can observe the facts as the following.
The
ellipse in the form ![]() and
and ![]() are the
horizontal ellipses.
are the
horizontal ellipses.
The ellipse in the form ![]() and
and ![]() are the vertical
ellipses.
are the vertical
ellipses.
Further, the larger of the absolute value of p indicates the bigger size of the ellipse.
Another observation we can see is that the sign of p
tells us about which ellipse is above
the other one for the ellipse in the form of ![]() and
and ![]() .
.
If p is
positive, the ellipse in the form of ![]() is above the
other one. In addition, for the
ellipse in the form of
is above the
other one. In addition, for the
ellipse in the form of ![]() and
and ![]() , the sign of p tell
us which one is on the right or left. We can notice that for p is positive,
, the sign of p tell
us which one is on the right or left. We can notice that for p is positive, ![]() is on the right.
is on the right.
Click HERE for the
investigation in gcf file
As the value of k decreases close to 0, we notice that
the ellipse seems the circle as shown in the figure below.
Finally,
we will explore for ![]() . The figures below show for k =2 with p =1 and p = -1, respectively.
. The figures below show for k =2 with p =1 and p = -1, respectively.
Click
HERE to explore in the gcf file.
From
the investigation, we can notice as follows.
The
graphs show the horizontal hyperbola for the equations ![]() and
and ![]() .
.
The
graphs show the vertical hyperbola for the equations ![]() and
and ![]() .
.
If p is positive, the hyperbola of the equation ![]() is on the left
of the
is on the left
of the ![]() by contrast for
the negative p.
by contrast for
the negative p.
Moreover,
as p is positive the hyperbola of
the equation ![]() is below of the
is below of the ![]() on the contrary
for the positive p.
on the contrary
for the positive p.
Besides,
as the absolute value of p increases, we can notice the distance between the
horizontal hyperbolas is extended as same as the distance between the vertical
hyperbolas.
If
the value of k increases, we will
see all graphs seem to be narrower. In other words, the asymptotic lines in
each graph keep closer.
Also,
for k more than and close to 1, we have to minimize the window to see the
graph of the hyperbola for more clearly. This suggests that the hyperbola is
much close to its asymptotic line as seen in the figure below.
Now,
we will discuss on the polar equations of the conic sections.
We
can derive the polar equations of a conic section by suppose that its focus is
the pole (the origin) and its directrix is the vertical line ![]() for
for ![]() as the figure
below.
as the figure
below.
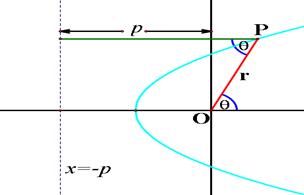
From
this, we have ![]() , so
, so ![]() . If the directrix is
. If the directrix is ![]() for the positive
for the positive
![]() , we have
, we have ![]() . So, we obtain the polar equation of the conic section with
eccentricity k, focus O, and the directrix
. So, we obtain the polar equation of the conic section with
eccentricity k, focus O, and the directrix ![]() as
as ![]() .
.
Similarly,
if the horizontal line ![]() is the directrix
of the conic section, then we have
is the directrix
of the conic section, then we have
![]() .
.
Then,
we will consider how the absolute value of p (the distance in this case) affects to the size of the
conic sections.
Let’s
consider for the case of an ellipse (![]() ). We will see that the vertices of an ellipse correspond to
). We will see that the vertices of an ellipse correspond to ![]() and
and ![]() . Also, we know that its length of the major axis is equal to
2a.
. Also, we know that its length of the major axis is equal to
2a.
Therefore, ![]() (
( ![]() )
)
Then, we get ![]() .
.
If ![]() , the graph will be the hyperbola or the parabola.
, the graph will be the hyperbola or the parabola.
Also, the major axis of the ellipse can be rotated for
a counterclockwise angle ![]() around its focus
at the origin.
around its focus
at the origin.
The
equation of ![]() is changed to be
is changed to be
![]() . For
. For ![]() , this equation represents a parabola or a hyperbola rotated
through the angle
, this equation represents a parabola or a hyperbola rotated
through the angle ![]() .
.
From
the polar equation of the conic section with eccentricity k, focus O, and
the directrix ![]() as
as ![]() , and
, and ![]() , we have the equation of an ellipse with eccentricity k, major semiaxis a, and the focus at the origin is represented by
, we have the equation of an ellipse with eccentricity k, major semiaxis a, and the focus at the origin is represented by ![]() .
.
We
will see that the above equation will be in the form ![]() if k approaches to 0. This is the equation of a circle.
if k approaches to 0. This is the equation of a circle.
From the equation ![]() for
for ![]() as
as ![]() , we may consider any circle as the an ellipse of
eccentricity zero with the directrix
, we may consider any circle as the an ellipse of
eccentricity zero with the directrix ![]() .
.
Also, from the equation ![]() , if k
approaches to 1. We have the limiting form of this equation is the equation of
a parabola.
, if k
approaches to 1. We have the limiting form of this equation is the equation of
a parabola.
We can consider for k = 1 for the parabola and k = 0.999 for the ellipse.
We
will see that the ellipse with the eccentricity k = 0.999 looks like the parabola as the below figure.
Click
HERE to explore in gcf file.