
Some of the explorations on the second degree equation
By
Ronnachai Panapoi
In this
write-up, we will investigate and summarize what we have seen from the second
degree equation (the quadratic equation) by using Graphing Calculator 3.6
as a tool of exploration.
The quadratic
equation is the equation in the form of
f(x) = ax2 + bx +c where
a, b, c are constants and a ![]() 0. The curve
of this function is called a parabola. In this specific case, it is a parabola
with a particular orientation (the axis of symmetry parallel to the y-axis).
0. The curve
of this function is called a parabola. In this specific case, it is a parabola
with a particular orientation (the axis of symmetry parallel to the y-axis).
In particular,
in this write-up, I will discuss on how these three constants have the impact
on the characteristics of the parabola.
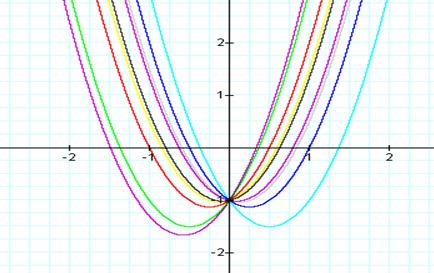
To begin with,
I will talk of the changes of the a having the
impact on the shape of the parabola.
Click
HERE to explore more shapes of this graph when a varies.
Think of what
you have seen from the graph of f(x)
if the value of a changes and compare the result of what you have
investigated to that of mine.
As a varies and approaches to 0, the parabola nearly
changes to be the straight line. This suggests that the straight line is as the
limit when a approaches 0 form either
side. Also, I can notice the difference of the graph when a
is positive and negative.
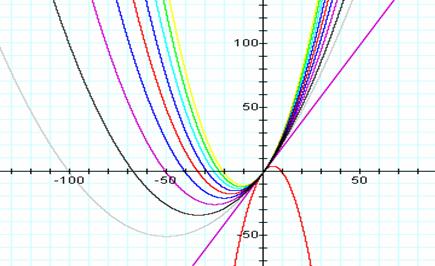
The above
figure displays when a is positive, we will see
that the parabola has the lowest point. By contrast, it has the highest point
in case that a is negative.
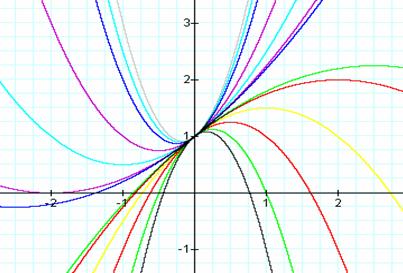
Next, I will
present what happen when the value of the constant b changes.
As the
b varies, I observe the changes of the parabola in the sense that it
moves on the tangent line passing through the coordinates (0, c). Therefore, a different tangent line for
each parabola goes through (0, c).
Let’s
click HERE to see whether or not the
above assumption is true.
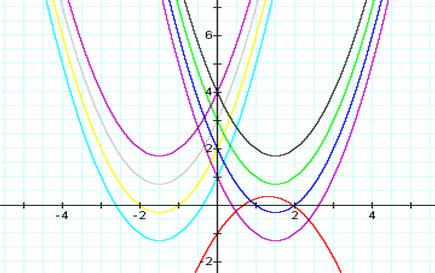
Lastly, we
will see the change of the parabola when the c varies.
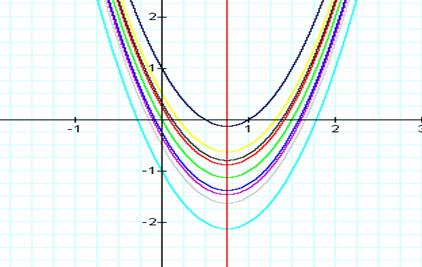
Click HERE to see graphs
of parabolas when c changes.
I have got the
fact that the vertex of the parabola moves on the line:  . Since, if we look back to the equation for each parabola
having the same constants a, b and represented as the equation y = ax2 + bx
+ c, it has the vertex as the coordinates (
. Since, if we look back to the equation for each parabola
having the same constants a, b and represented as the equation y = ax2 + bx
+ c, it has the vertex as the coordinates ( ).
).
From this, we
will see that as only a value of the constant c changes, the y-coordinate of the vertex also changes.
But, the x-coordinate remains ![]() . So, it can verify that the I have got the fact that the
vertex of the parabola moves on the line:.
. So, it can verify that the I have got the fact that the
vertex of the parabola moves on the line:.