
The Cost of the Stamp
by
Susan Sexton
The cost of the
first class letter postage for the US Mail has increased fairly rapidly from
1933 to 2006. Below is a table displaying the various costs of the stamp over
the years. This is an exploration
to find a function that may serve to predict when future increases may
occur.


Looking at the above scatter plot of the data, it
appears that the graph of the data has some form to it. The question is, what is that
form? Let’s explore some possibilities
by having excel do some regression analysis for us.
Exponential Regression

While there appears to be some alignment to the data, the exponential regression does not appear to fit the data that well, even though the correlation would indicate otherwise.
Quadratic Regression

The quadratic regression appears to fit the data
closer but still leaves me feeling there may be something even better yet.
Hmm . . . let us move on and see if something else
might work better.
Linear Regression
(with all points included)

The linear regression that includes all data points
definitely does not fit the data well.
However, if we exclude a couple of the outliers, the data does appear
linear. Let us remove the outliers
and see what happens.
Linear Regression
(with outliers omitted)

This regression appears to fit the data best yet!
Prediction Equations
Now we have our regression equations, let’s see what
happens when we try to make predictions.
It would also be neat to see how outcomes match the already known cost
of stamps.
Exponential Regression

Using the exponential regression, we can see it is a
little off than what our stamp prices currently are. However, if we were to depend on this as our prediction
equation then a stamp will cost $1.00 in 2028. Additionally we can expect another increase this year (2006)
where the cost of the stamp will be 44 cents!
Quadratic Regression

What is going on with the quadratic regression?
These numbers are not even close to the known stamp
prices.
Is this a mistake in Excel?
Or is it that the data simply cannot be fit with a
quadratic equation?
Let me readjust the scale from x = 0 representing
1900 to x = 0 represents 0 and graph that with the new
prediction equation.

Now let us see what this new prediction equation does.

This certainly worked better!
The values appear to be in line with the known stamp values.
Additionally, we can estimate that the cost of the
stamp will reach $1.00 in 2043.
Power Regression

Using the power regression, we can see it is a bit
closer to our stamp prices then the exponential regression. But if we were to depend on this as our
prediction equation then a stamp will cost $1.00 in 2033 and we can expect
another increase in 2009 where the cost of the stamp will be 49 cents.
Linear Regression
(with outliers omitted)
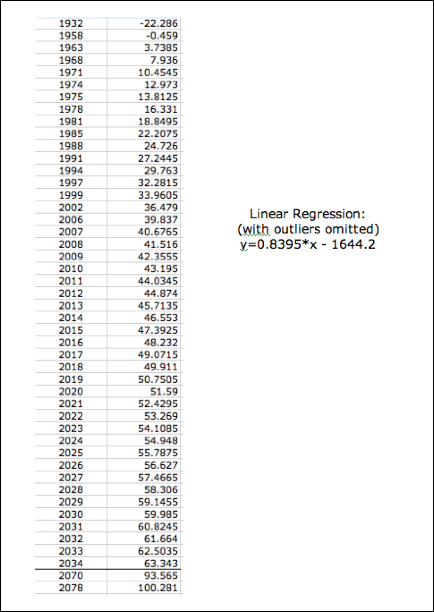
I did not include a table of the linear regression
that included all data points since that graph was way off the known stamp
prices. However the linear
regression with the outliers omitted appears to fit the data best. It is also a hopeful prediction
equation in comparison to the others since it will be 2078 when the cost of a
stamp reaches $1.00. I had to
compute backwards when I noticed that in 2034 the cost was not close to
reaching $1.00 like it was for the other prediction equations. Furthermore, we can expect another
increase in 2007 where the cost of the stamp will be 41 cents.
Discussion:
What
other types of regression equations could we try?
What
other data might lend itself well to a similar exploration?