
Parametric Curves
A Presentation for Pre-Calculus Students
By Paulo Tan
Lets take a close look at the
parametric equation x=cos (t) and y=sin(t) where t goes from 0 to 2pi. You see that the variables x and y will
depend on t; and each t value gives us a coordinate point.
So lets think about what kind
of graph this parametric equation will produce.
We know that sine and cosine
are periodic functions. Hence,
lets construct a table to get a sense of what kind of values and trends this equation
gives us. The table below
describes the values of x and y as t increases.
|
|
CASE 1
x=cos(t), y=sin(t) |
||
|
t |
t |
x |
y |
|
0 |
0.00 |
1 |
0 |
|
pi/4 |
0.79 |
0.71 |
0.71 |
|
pi/3 |
1.05 |
0.50 |
0.87 |
|
pi/2 |
1.57 |
0.00 |
1.00 |
|
3pi/4 |
2.36 |
-0.71 |
0.71 |
|
5pi/6 |
2.62 |
-0.87 |
0.50 |
|
pi |
3.14 |
-1.00 |
0.00 |
|
7pi/6 |
3.66 |
-0.87 |
-0.50 |
|
5pi/4 |
3.93 |
-0.71 |
-0.71 |
|
3pi/2 |
4.71 |
0.00 |
-1.00 |
|
11pi/6 |
5.76 |
0.86 |
-0.50 |
|
2pi |
6.28 |
1.00 |
0.00 |
These values should not
surprise you since you are familiar with trigonometric functions. It also should be no surprise that the
graph of this parametric function is that of a unit circle (fig1).
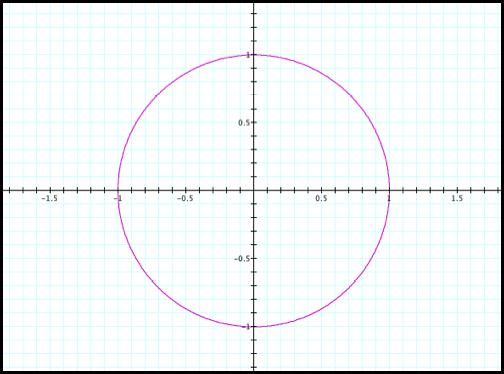
Fig1.
Now let’s think about what kind
of graph would be produced if the parametric equation is x=cos(3t) and
y=sin(t). Again, lets start with a
table of values for this case.
|
|
CASE 2 |
x=cos(3t) |
y=sin(t) |
|
|
|
|
|
|
|
|
t |
t |
3t |
x |
y |
|
0 |
0.00 |
0.00 |
1.00 |
0.00 |
|
pi/4 |
0.79 |
2.36 |
-0.71 |
0.71 |
|
pi/3 |
1.05 |
3.14 |
-1.00 |
0.87 |
|
pi/2 |
1.57 |
4.71 |
0.00 |
1.00 |
|
3pi/4 |
2.36 |
7.07 |
0.71 |
0.71 |
|
5pi/6 |
2.62 |
7.85 |
0.00 |
0.50 |
|
pi |
3.14 |
9.42 |
-1.00 |
0.00 |
|
7pi/6 |
3.66 |
10.99 |
-0.01 |
-0.50 |
|
5pi/4 |
3.93 |
11.78 |
0.70 |
-0.71 |
|
3pi/2 |
4.71 |
14.13 |
0.01 |
-1.00 |
|
11pi/6 |
5.76 |
17.27 |
-0.01 |
-0.50 |
|
2pi |
6.28 |
18.84 |
1.00 |
0.00 |
Remember that the period of
cos(3t) is now 2pi/3. Thus, the x
values complete three cycles,
while the y values are still on a single cycle. Recall that in a single cycle, the cosine function has two
common values since cos(x)=cos(-x).
The exceptions are when x=pi and 2pi. We would then expect that each cos(3t) value will have up to
six different t values.
Think about the
intercepts. In Case 1, we have two
x-intercepts and two y-intercepts.
Lets do some computation to see if we get six y-intercepts.
We
know that cos(t)=0 when t is pi/2 or 3pi/2.
Thus cos(3t)=0 when 3t=pi/3 or 3t=3pi/2.
So t=pi/2 and pi/6. Remember that cos(x)=-cos(x).
Thus, we have t=pi/2, -pi/2, pi/6, and -pi/6. Since (-pi/2)=3pi/2,
and (-pi/6)=11pi/6.
We
also need to consider the additional period of 2pi/3 in cos(3t). Since cos(x)=cos(x+2pi), then
cos(t)=cos(t+2pi/3).
So
use t=pi/2 since the sum of pi/2 and 2pi/3 is 7pi/6 which is still within the
domain of t. Similarly use t=pi/6
where the sum of pi/6 and 2pi/3 is 5pi/6.
Hence
cos(3t)=0 for t=pi/2, pi/6, 7pi/6, 11pi/6, 5pi/6, and 3pi/2.
So we know the graph in Case
2 has six y-intercepts and two x-intercepts.
A table of values for the
y-intercepts shows:
|
|
CASE 2: |
|
cos(3t) |
sin(t) |
|
t |
t |
3t |
x |
y |
|
pi/6 |
0.52 |
1.57 |
0.00 |
0.50 |
|
pi/2 |
1.57 |
4.71 |
0.00 |
1.00 |
|
5pi/6 |
2.62 |
7.85 |
0.00 |
0.50 |
|
7pi/6 |
3.66 |
10.99 |
-0.01 |
-0.50 |
|
3pi/2 |
4.71 |
14.13 |
0.01 |
-1.00 |
|
11pi/6 |
5.76 |
17.27 |
-0.01 |
-0.50 |
Although there are six different
t values for the y-intercept, there are only four unique y-intercepts since
sin(7pi/6)=sin(11pi/6) and sin(pi/6)=sin(5pi/6).
Lets investigate
other values such as when x=.5.
We
know that cos(t)=.5 when t is pi/3 or 5pi/3.
Thus
cos(3t)=.5 when 3t=pi/3 or 3t=5pi/3.
So
t=pi/9 and 5pi/9. Again cos(x)=-
cos (x).
Thus,
we have t=pi/9, (-pi/9), 5pi/9, (-5pi/9) or
t=
pi/9, 17pi/9, 5pi/9, and 13pi/9
We also need to
consider the additional period of 2pi/3 in cos(3t). Since cos(x)=cos(x+2pi), then cos(t)=cos(t+2pi/3).
So use t=pi/9
since the sum of pi/9 and 2pi/3 is 7pi/9 which is still within the domain of
t. Similarly use t=5pi/9
where the sum of 5pi/9 and 2pi/3 is 11pi/3.
Hence cos(3t)=.5
for t=pi/9, 5pi/9, 7pi/9, 11pi/9, 13pi/9, and 17pi/9.
Just as we expected the
calculation above shows six t values for each cos(3t) value.
The table of values for
cos(3t)=.5 shows six distinct points.
|
|
CASE 2 |
|
cos(3t) |
sin(t) |
|
t |
t |
3t |
x |
y |
|
pi/9 |
0.35 |
1.05 |
0.50 |
0.34 |
|
5pi/9 |
1.74 |
5.23 |
0.50 |
0.98 |
|
7pi/9 |
2.44 |
7.33 |
0.50 |
0.64 |
|
11pi/9 |
3.84 |
11.51 |
0.49 |
-0.64 |
|
13pi/9 |
4.54 |
13.61 |
0.51 |
-0.98 |
|
17pi/9 |
5.93 |
17.79 |
0.49 |
-0.34 |
Lets investigate the value of
x=1.
We know that
cos(t)=1 when t is 2pi.
Thus
cos(3t)=1 when 3t=2pi.
So
t=2pi/3. Again cos(x)= -cos (x).
Thus,
we have t=2pi/3 and (-2pi/3)
t=
2pi/3 and 4pi/3
We
also need to consider the additional period of 2pi/3 in cos(3t). Since cos(x)=cos(x+2pi), then
cos(t)=cos(t+2pi/3).
So
use t=2pi/3 since the sum of 2pi/3 and 2pi/3 is 4pi/3 which is still within the
domain of t. Similarly use t=4pi/3
where the sum of 4pi/3 and 2pi/3 is 2pi.
Hence
cos(3t)=1 for t=2pi/3, 4pi/3, and 2pi. We knew that there is only one solution for t for
cos(t)=1. So for cos(3t) should
result in three solutions.
|
|
CASE 2 |
|
cos(3t) |
sin(t) |
|
t |
t |
3t |
x |
y |
|
2pi/3 |
2.09 |
6.27 |
1.00 |
0.87 |
|
4pi/3 |
4.19 |
12.56 |
1.00 |
-0.86 |
|
2pi |
6.28 |
18.84 |
1.00 |
0.00 |
Here is a summary of our
findings so far for the parametric equation in Case 2:
a) cos(3t) has a period of 2pi/3, thus we should have at
most six values of t for each cos(3t) value.
b) there are six y-intercept values, however, only four
of those are distinct.
c) there is only one solution for cos (t)=1 or cos(t)=-1,
thus for cos(3t)=1 or cos(3t)=-1 we should expect only three solution for each
of those cases.
This gives us a good starting
point before plotting the graph of x=cos(3t) and y=sin(t). We could also
continue calculating table of values for different cos(3t) values if
needed. Lets now look at the graph
of the equation for Case 2 (fig2).
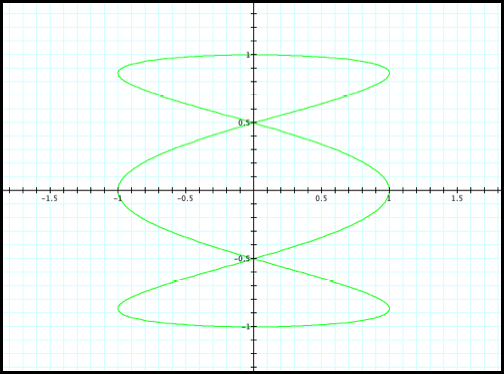
Fig2.
What would you expect for a
parametric equation: x=cos(5t) and y=sin(t) for t between 0 and 2pi? At most 10 different solutions for each
cos(5t)?
Lets graph and see (fig3):
Case 3: x=cos(5t) and y=sin(t)
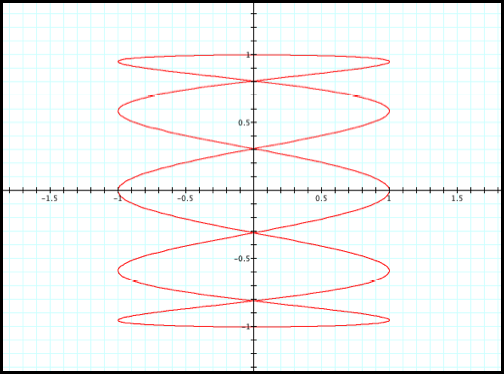
Fig3.
Thus, we could expect similar
results for x=cos(7t) and y=sin(t) (fig4).
Case 4: x=cos(7t) and y=sin(t)
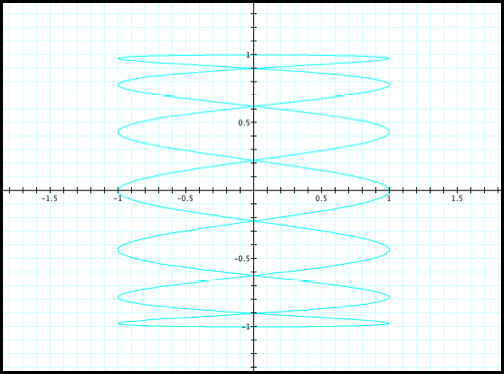
Fig4.
What about when the roles are
switched? Take for instance
x=cos(t) and y=sin(3t) for t values from 0 to 2pi (fig5).
Case5: x=cos(t) and y=sin(3t)
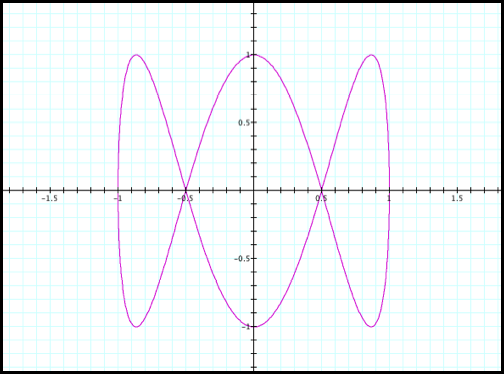
Fig5.
We could see that Case 5 is
very similar to Case 3. Remember
that sin(x) is an even function, thus symmetric about the y-axis. When the odd multiplier is on the sine
function (i.e. sin(nt)) we should expect n number of y values for each t
value. A good way to think about
this is to use the horizontal line test to see how many times the graph
intersects the horizontal line.
Where as when the odd multiplier is on the cosine function (i.e.
cos(nt)) we should expect n number of x values for each t value. Thus the intersection of a vertical
line and the graph provides a good test for this case.
Notice that in Case5, the
graph shows only three y values at -1 and 1. A similar computation to the cosine computation in the
previous cases could be done to verify why.
We should expect similar
results for the equation x=cos(t) and y=sin(5t) (fig6).
Case 6: x=cos(t) and y=sin(5t)
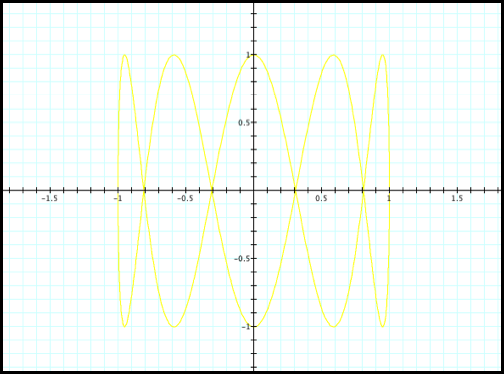
Fig6.
What about the parametric
equation x=cos(2t) and y = sin(t) for t values between 0 and 2pi (fig7)?
Case 7: x=cos(2t) and y=sin(t)
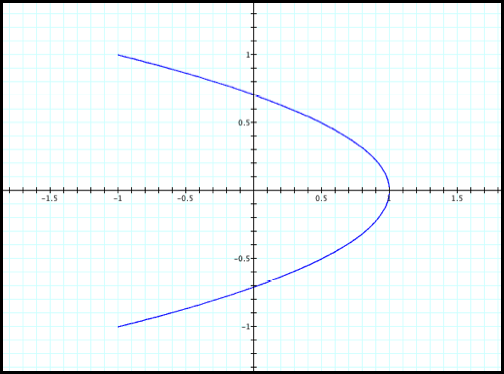
Fig7.
The graph of Case 7 looks
very different from the previous cases.
It looks like the equation is producing two x values for each t value
instead of four as we might expect.
The exception is when x=1.
Lets investigate other values
such as when x=.5.
We know that
cos(t)=.5 when t is pi/3 or 5pi/3.
Thus
cos(2t)=.5 when 2t=pi/3 or 2t=5pi/3.
So
t=pi/6 and 5pi/6. Again cos(x)=-
cos (x).
Thus,
we have t=pi/6, (-pi/6), 5pi/6, (-5pi/6) or
t=
pi/6, 5pi/6, 7pi/6, 11pi/6.
The
corresponding y-values are: .5, .5. -.5, and -.5.
We
see that there are four values of x for each t value. However, only two of the corresponding y-values are
distinct. The graph indicates
similar results for other x values.
|
|
CASE 7 |
|
cos(2t) |
sin(t) |
|
t |
t |
2t |
x |
y |
|
0 |
0.00 |
0.00 |
1.00 |
0.00 |
|
pi/4 |
0.79 |
1.57 |
0.00 |
0.71 |
|
pi/3 |
1.05 |
2.09 |
-0.50 |
0.87 |
|
pi/2 |
1.57 |
3.14 |
-1.00 |
1.00 |
|
3pi/4 |
2.36 |
4.71 |
0.00 |
0.71 |
|
5pi/6 |
2.62 |
5.23 |
0.50 |
0.50 |
|
pi |
3.14 |
6.28 |
1.00 |
0.00 |
|
7pi/6 |
3.66 |
7.33 |
0.50 |
-0.50 |
|
5pi/4 |
3.93 |
7.85 |
0.00 |
-0.71 |
|
3pi/2 |
4.71 |
9.42 |
-1.00 |
-1.00 |
|
11pi/6 |
5.76 |
11.51 |
0.49 |
-0.50 |
|
2pi |
6.28 |
12.56 |
1.00 |
0.00 |
For cos(2t)=1 when t=pi and
t=2pi. The corresponding y-values
would be sin(pi)=0=sin(2pi).
On the other hand cos(2t)=-1
when t=pi/2 and 3pi/2. The
corresponding y-values are sin(pi/2)=1 and sin(3pi/2)=-1. Thus, the graph of Case 7 does not
“close” like in the previous cases.
Lets look at the next even
number (fig8):
Case 8: x=cos(4t) and y=sin(t)
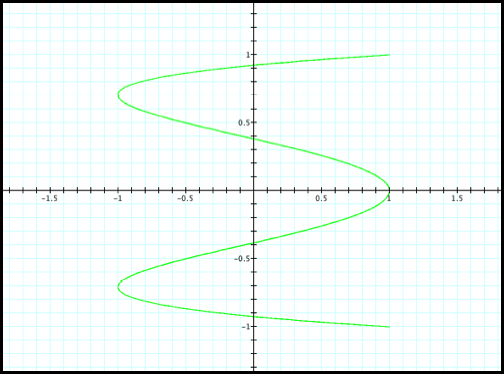
Fig8.
We notice a similar graph to
Case 7, but it “opens” to the opposite side. As expected, most of the graph shows four x values for each
t value. The exception is once
again at x=1 and -1.
Some computation should
clarify these exceptions:
cos(4t)=1
when t=pi/2, pi, 3p/2, and 2pi.
The corresponding y values are 1, 0, -1, 0.
cos(4t)=-1
when t=pi/4, 3pi/4, 5pi/5, and 7pi/4.
The corresponding y values: root 2/2 and –root2/2.
Thus, the computation shows
that Case 8 has three distinct y values at x=1 and two distinct y values at
x=-1.
We begin to see a pattern as
the even number increases (fig9 and fig10).
Case9: x=cos(6t) and y=sin(t)
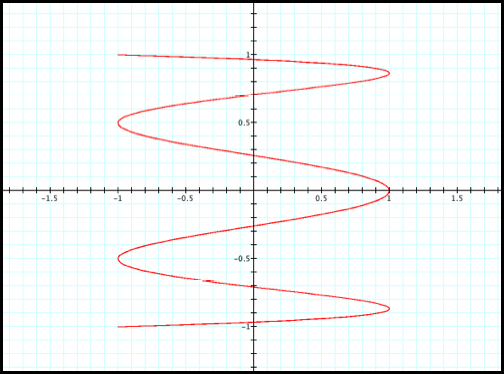
Fig9.
Case10: x=cos(8t)
and y=sin(t)
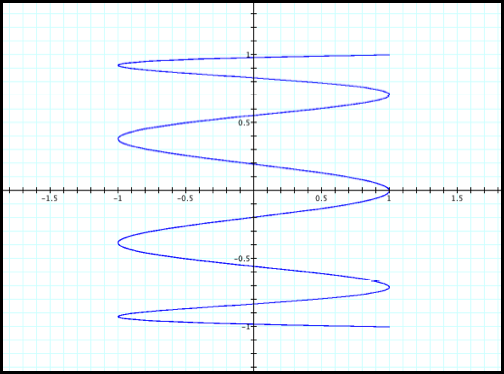
Fig10.
Now lets look when the even
numbers multiplies t in the sine function (fig11).
Case 11: x=cos(t) and y=sin(2t)
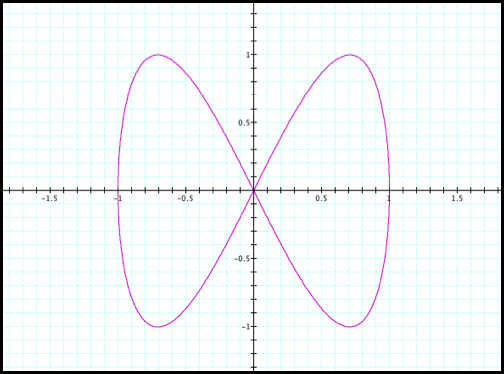
Fig11.
The even multiplier on the sine
function does not seem to have the same outcome as the even multiplier on the
cosine function. We do see up to
four distinct solutions for each t value.
The exceptions are once again at y values -1, 1, and 0.
sin(t)=1
when t=pi/2. So sin(2t)=1 for only
two t values, t=pi/4, 5pi/4. The
corresponding x values are root 2/2 and –root2/2.
sin(t)=0
when t=pi, and 2pi. So sin(2t) =0
when t=pi, pi/2, 3pi/2, and 2pi.
The corresponding x values are -1, 0, 0, and 1. So there are three distinct points when
sin(2t)=0.
We see similar results for
higher even multipliers in the sine function (fig12 and fig 13).
Case 12: x= cos(t) and y=sin(4t)
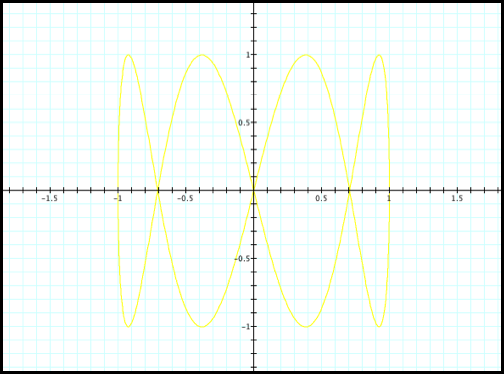
Fig12.
Case 13: x=cos(t) and y = sin(6t)
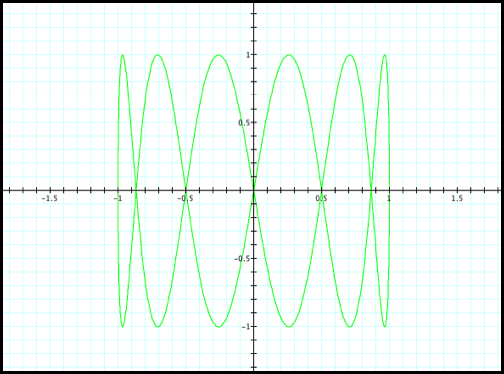
Fig13.
In this presentation we
discussed the parametric curves x=cos (nt) and
y= sin (mt) where m and n are positive integers;
and in each of the thirteen cases discussed, either m or n was 1.
For homework:
a) Investigate the cases where m and n are negative
integers. Explain why the graph
behaves a certain way.
b) Investigate the cases where m and n are positive
integers but neither m nor n is 1.
c) Investigate the cases where m and n are the same. Explain why the graph is the same.