
Polar Coordinates
A Presentation for Pre Calculus Students
By Paulo Tan
Here is our first example:
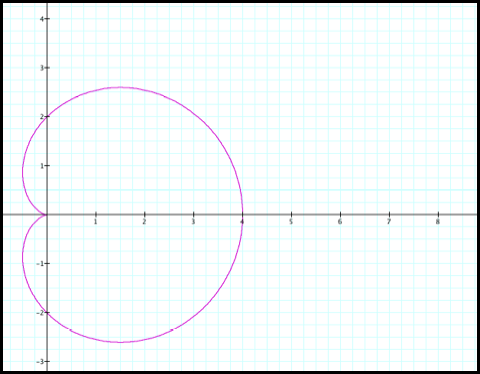
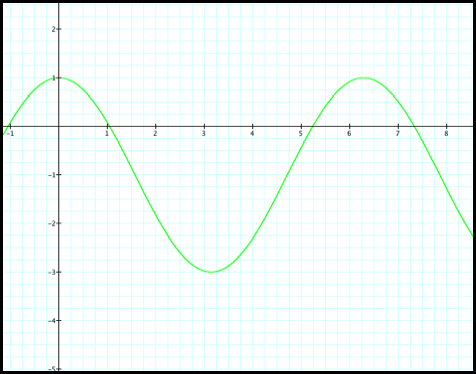
Sketch the graph of r = 2+2cosq. We’ll
start by graphing in the rectangular coordinate (fig1). We’ll use the graph in the rectangular coordinate
to help us graph in the polar coordinate.
(Note: Some browsers may
display pheta as q. Depending on the
browser you’re using the rotation angle may either be pheta or q)
Case 1: r
= 2+2cosq
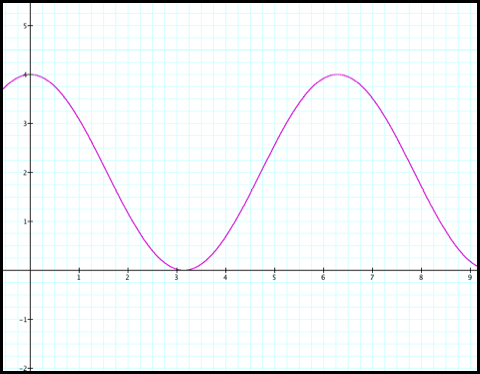
Fig1
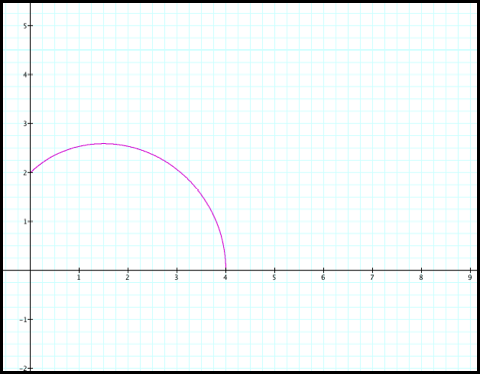
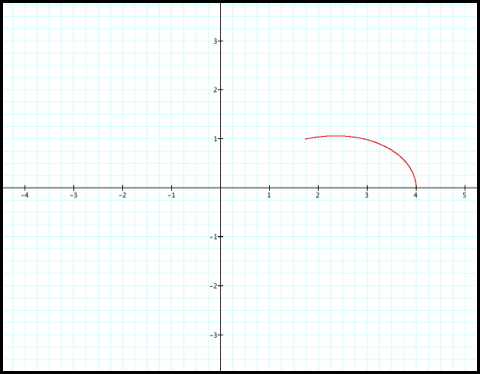
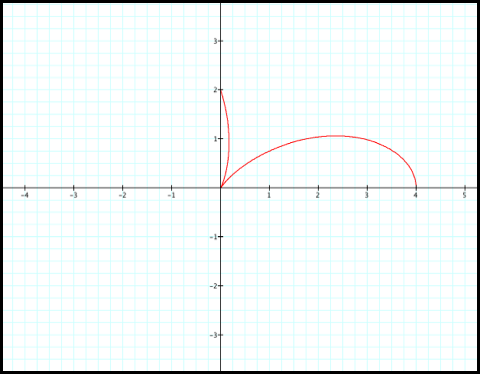
1) Notice that r decreases
from 4 to 2 as q increases from 0 to pi/2. So plotting this in polar coordinate gives us:
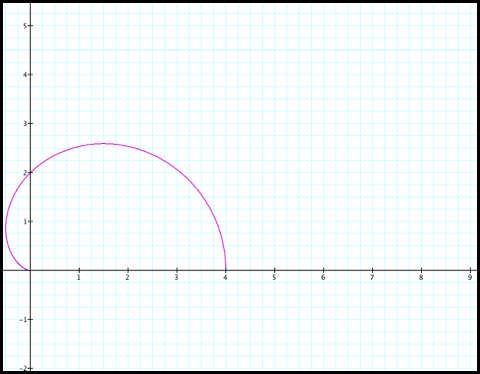
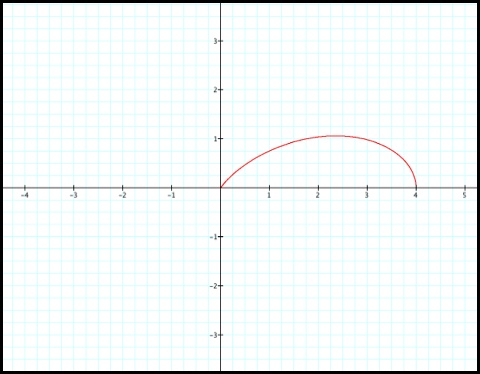
2) Next, r
decreases from 2 to 0 as q increases from pi/2 to pi.
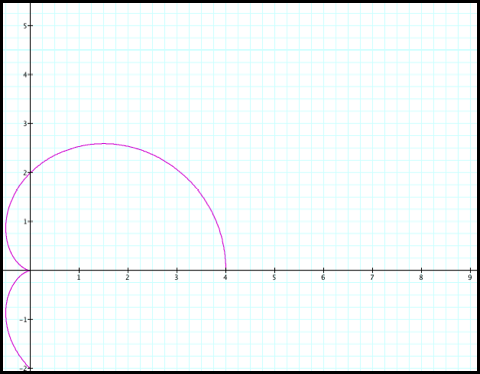
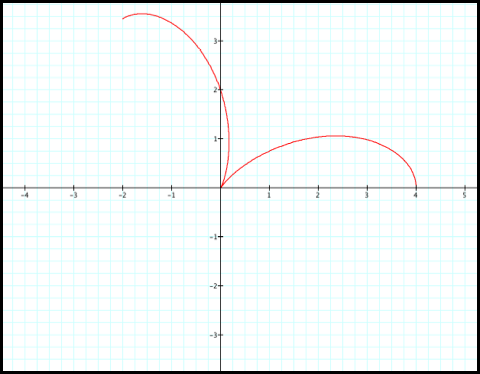
3) r increases
from 0 to 2 as q increases from pi to 3pi/2:
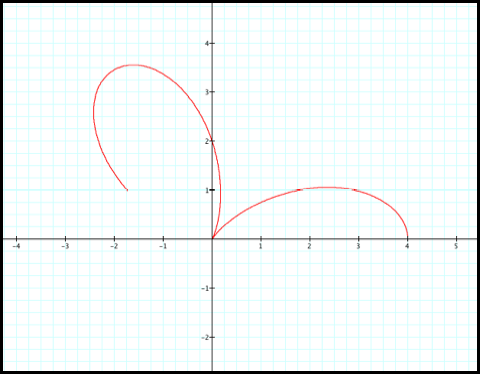
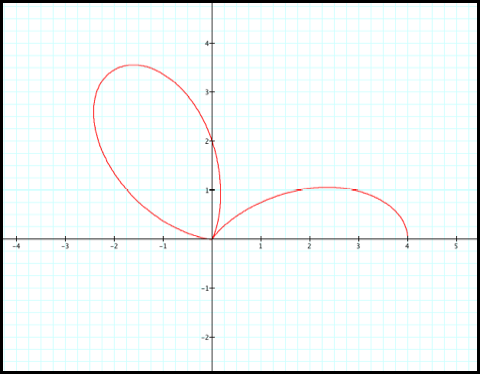
4) r increases
from 2 to 4 as q increase from 3pi/2 to 2pi:
Next, lets sketch the graph
of r
= 2+2cos(3q).
Again to help us construct this
equation in polar coordinates we’ll use the graph in the rectangular coordinate
plane (fig2).
Case 2: r =
2+2cos(3q)
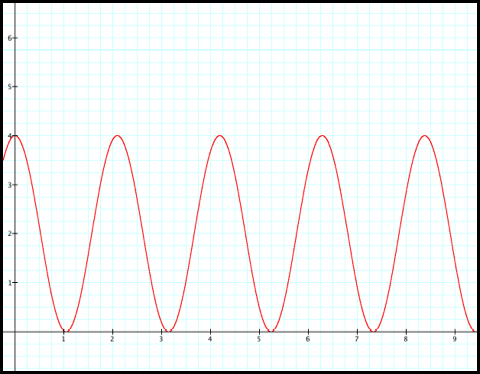
Fig2.
As expected, the graph in
case two completes three full cycles for q values of 0 to 2pi.
1) Notice that r decreases
from 4 to 2 as q increases from 0 to pi/6.
So plotting this in polar coordinate gives us:
2) Next, r decreases from 2
to 0 as q
increases from pi/6 to pi/3:
3) r increases from 0 to 2 as
q increases from pi/3 to
pi/2:
4) r increases
from 2 to 4 as q increase from pi/2 to 2pi/3:
5) r decreases
from 4 to 2 as q increases from 2pi/9 to 5pi/6:
6) r decreases from 2 to 0 as q increases from
5pi/6 to pi:
7) r increases
from 0 to 2 as q increases from pi to 7pi/6:
8) r increases from 2 to 4 as
q increases from 7pi/6 to
4pi/3:
9) r decreases from 4 to 2 as
q increases from 4pi/3
to 3pi/2:
10) r decreases from 2 to 0
as q increases from 3pi/2 to
5pi/3:
11) r increases from 0 to 2
as q increases from 5pi/3 to
11pi/6:
12) r increases from 2 to 4
as q increases from 11pi/6 to
2pi:
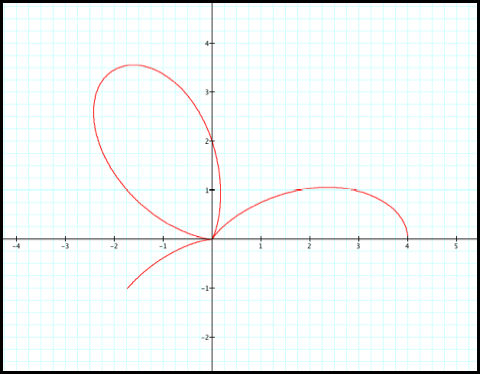
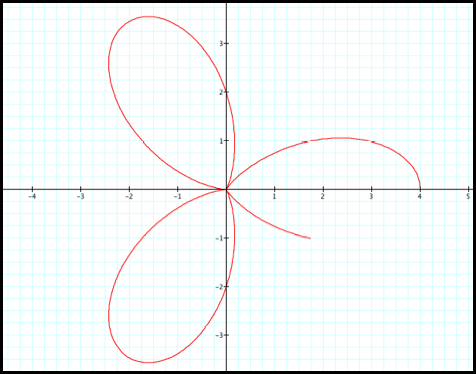
What do you think the graph
of r = 2 + 2cos(5q) will look like? As you
probably predicted (fig3), since you know the equation shows five cycles.
Case 3: r =
2 + 2cos(5q)
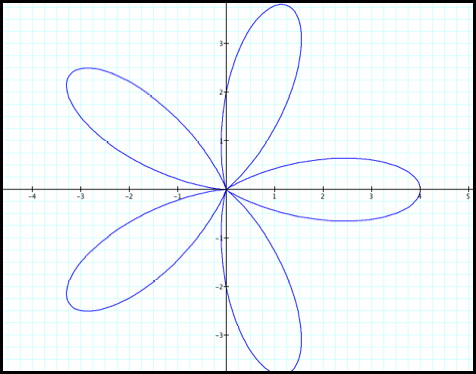
Fig3.
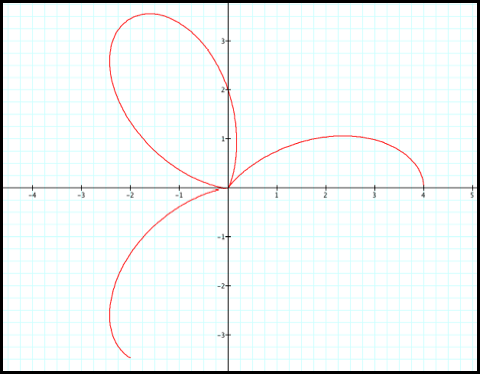
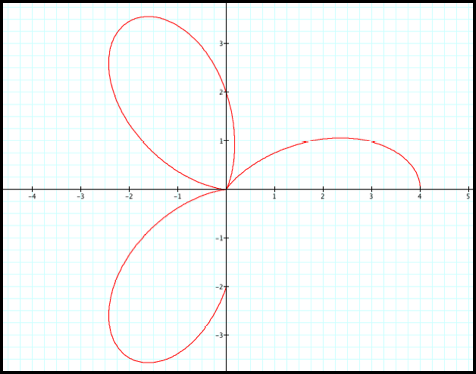
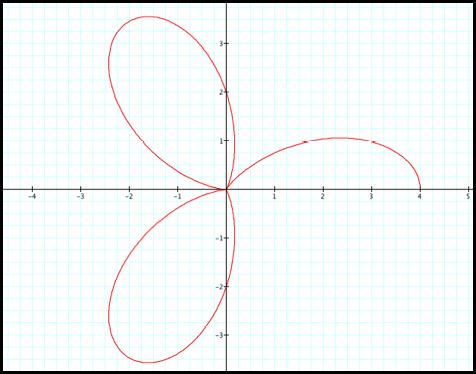
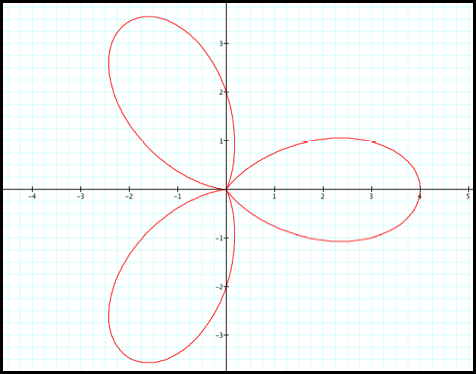
We should then expect similar
results for the even multipliers of q (fig 4, 5, and 6).
Case 4: r
= 2 + 2cos(2q)
Case 5:
r = 2 + 2cos(4q)
Case 6: r
= 2 + 2cos(8q)
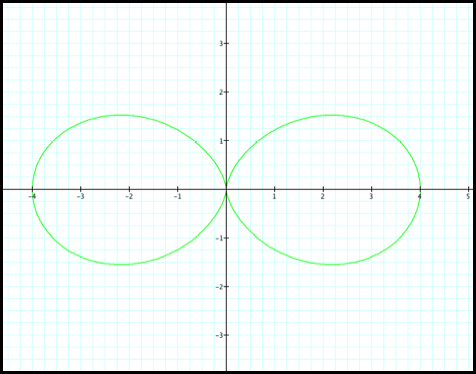
Fig4.
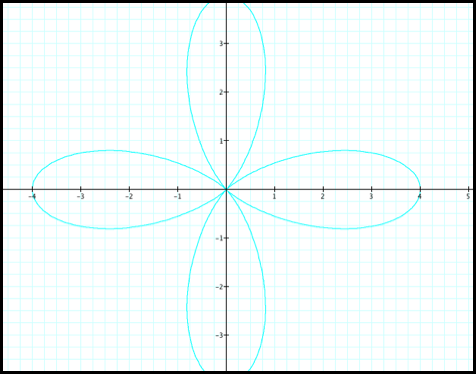
Fig5.
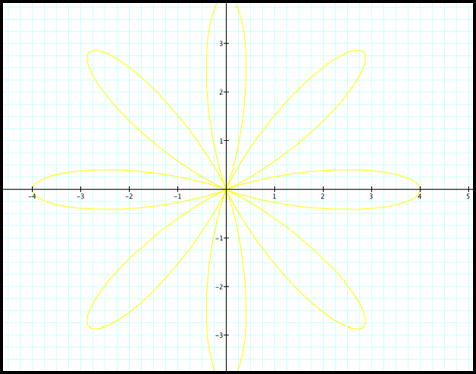
Fig6
The examples we investigated so
far has focused on the equation of form
r = a +bcos(kq), where a=b=2.
Let's try some other values for a and b (fig7). Since the period is the same in all
three equations, it should keep its base shape. However, the different “shrink/stretch” changes the size of
the graph.
Case 7: r =
-1-1cos(2q), r = 2 + 2cos(2q), and r= 3 + 3cos(2q)
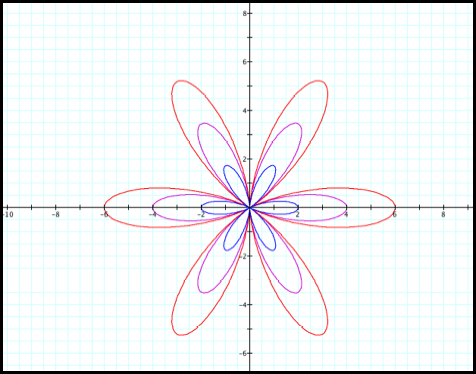
Fig 7
Lets see what happen when the
a and b values are different but with k =1.
Case 8: r =
-1 + 2 cos(q)
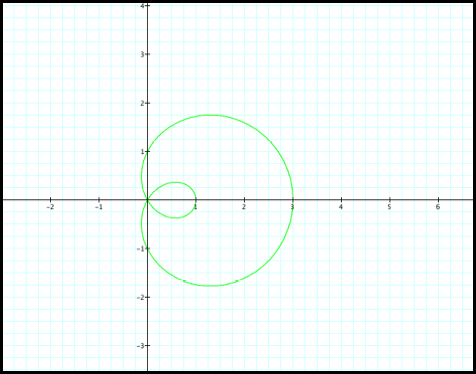
Fig8.
We see that the graph is very
similar to the one in Case 1. Lets
again refer to the rectangular coordinate to help us along. We notice the only change in the
equation from Case 1 to Case 8 is the a value. Recall that the a value shifts the graph up/down. Thus the graph for Case 8 in the
rectangular coordinate should come as no surprise:
You notice that we will
encounter negative r values.
1) According to the rectangular graph of Case 8, it looks
the polar graph starts at r=1 and decreases to 0, as q increases from 0 to pi/3.
2) r decreases from 0 to -1, as q increases from pi/3 to pi/2
Here
we have our first negative r value.
Negative r values takes on the point which is on the straight line
directly opposite from the positive r value (fig8b). In other words the points with negative r values would
be on the opposite quadrants as the points with positive r values. Another way to think about it is as a
reflection about the origin.
The
purple curve represents r increasing from 0 to 1, as q increases from pi/3 to pi/2. The purple curve is the familiar curve
we’ve encountered so far with positive r values. On the other hand, the graph of Case 8 (green curve),
represents r decreasing from 0 to -1, as q increases from pi/3 to pi/2.
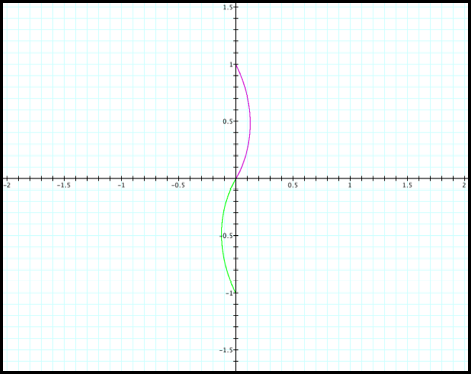
Fig8b.
3) r decreases from -1 to -3, as q increases from pi/2 to pi. We are still working with negative r values. So by looking at the purple curve
(fig8c) we could operate a reflection about the origin to obtain the graph of
Case 8 for the interval pi/2 to pi.
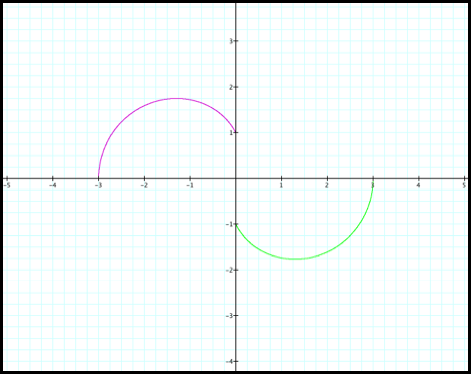
Fig 8c.
4) r increases from -3 to -1, as q increases from pi to 3pi/2 (fig8d).
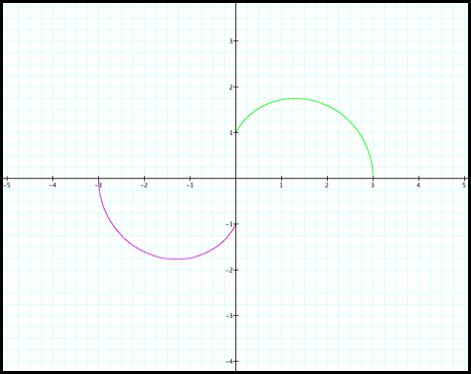
Fig 8d.
5) r increases from -1 to 0, as q increases from 3pi/2 to 5pi/3 (fig8e).
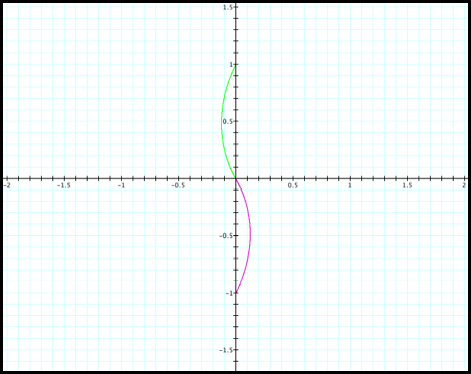
Fig 8e.
6) r increases from 0 to 1, as q increases from 5pi/3 to 2pi (fig8f). Now we are back to positive r values.
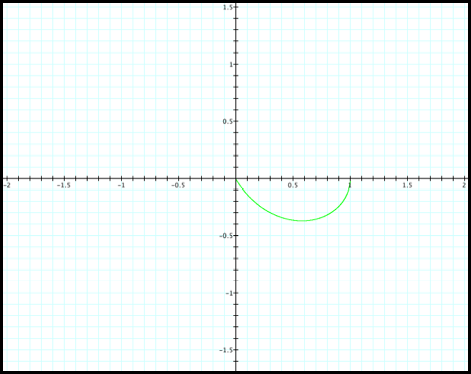
Fig 8f.
We notice similar results for
various values of a and b such that a is less than b (fig9).
Case 9: r =
1+2cosq, r = -1+3cosq, and r = -2+4cosq
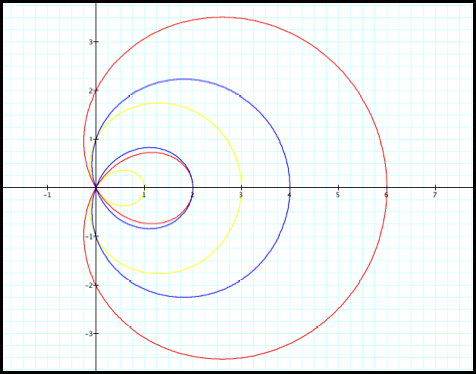
Fig9.
Case 10: r = 7
+6cosq and r=6+7cosq.
The two graphs in Case 10 are
very similar. In one equation the
b value is greater than a. So in
the purple graph the “loop” is missing.
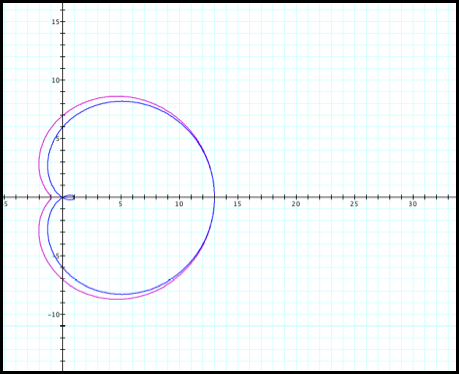
Fig10.
Lets compare the rectangular
coordinate graphs in Case 10.
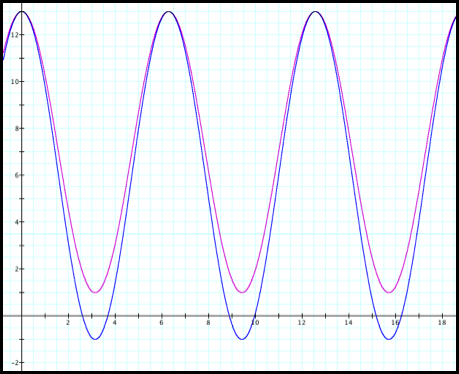
In both instances r begins at
7. Notice that in the blue graph
the r value reaches zero and then goes to -1. Thus when b is bigger than a, or when its stretch is bigger
than the vertical shift, the graph takes on an “extra” r value which accounts
for the “loop.”
Now what if there was no
vertical shift?
Consider Case 11:
r = 2cosq
(fig11).
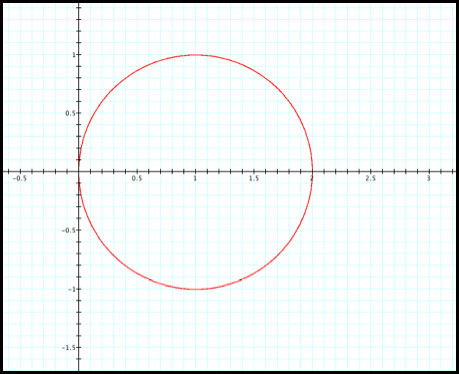
fig 11.
Case 11 appears to be a
circle with radius of 2. Lets look
at the rectangular coordinate for this case:
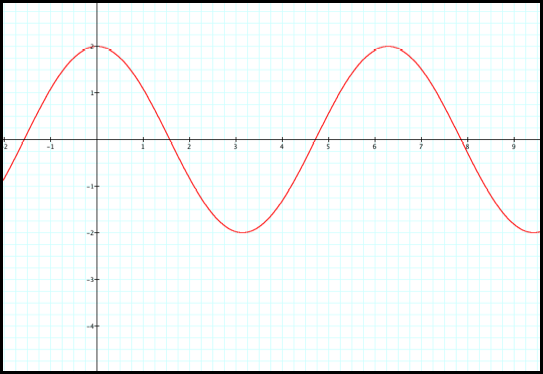
We will run into the negative
r values again. Lets look at the
progression in polar coordinates:
1) r decreases from 2 to 0 as q increases from 0 to pi/2
2) r decreases from 0 to -2 as q increases from pi/2 to pi.
It appears that we complete
the full circle in the interval from 0 to pi. Again the number in front the cosine appears to determine
the radius of the circle. Lets look
at other illustrations (fig12).
Case 12: r = 4cosq, r = 3cosq, and r = .5cosq
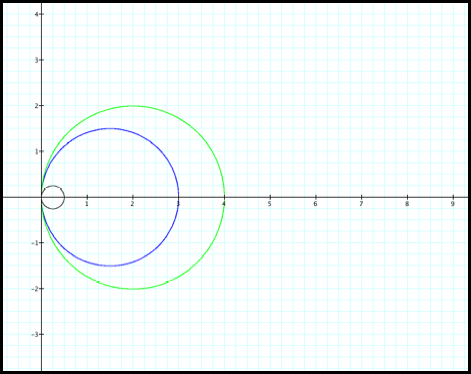
Fig 12.
Next, we’ll look at equations
with no vertical shift but with different periods.
Case 13: r = cos(3q). How do
you think this graph will look? Remember
the period is changed. As you may have expected we get similar results as with
Cases 2 through 7 without the effect of the vertical shift (fig 13).
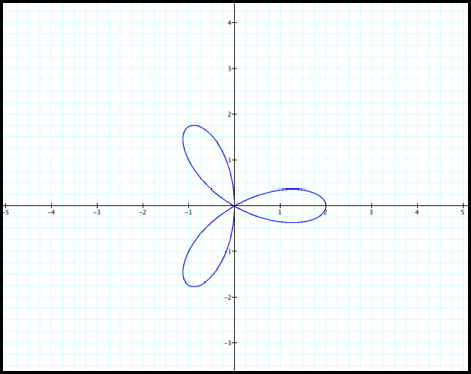
Fig 13.
Comparing Case 11 with an equation with
a vertical shift such as r
= 1+cos3q (fig13b) you see how the vertical shift affects the graph.
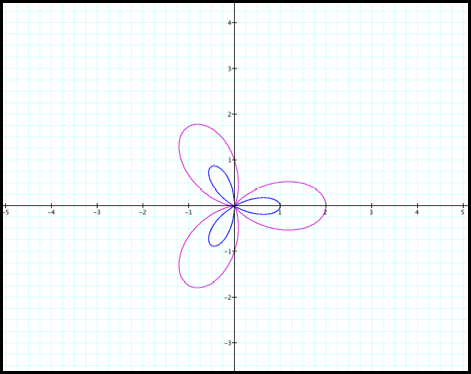
Fig 13b
We investigated both rectangular and polar coordinate
graphs of r = a + bcos(kq). We started with cases
where a and b are the same
with various k values. Then, we looked at cases where a and b were different but
with k value of 1. Lastly, we
looked at equations
where a is zero with various b and k values.
You will now work in groups to explore and explain:
1) The cases where a and b are different with various k
values.
2) The cases involving the equation r = a + bsin(kq).