
Feeling a bit Bi-Polar
Presented By
Dana TeCroney
The
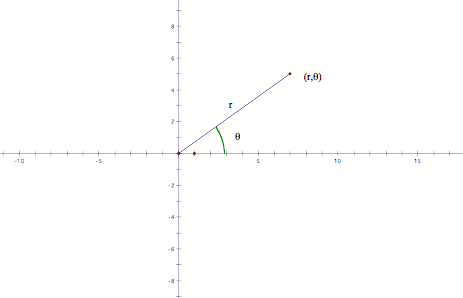
purpose of this investigation is to explore polar equations. Polar equations are represented with a
radius (r) and an angle from the x-axis (q).
The
equation I would like to consider is of the form
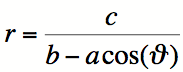
What
does a graph of this equation look like as the coefficients vary?
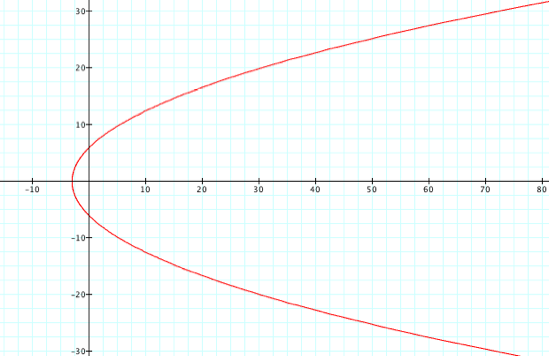
If
a = b = c = 1, then the graph results in the following (q = 0…2p):
![]()
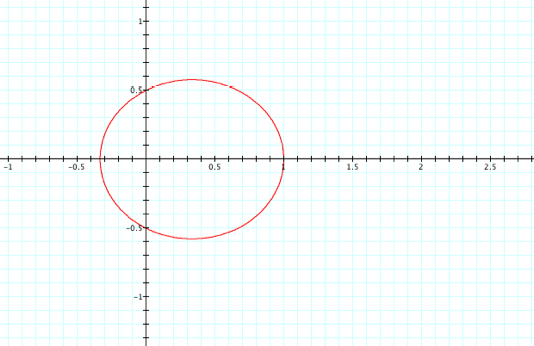
This
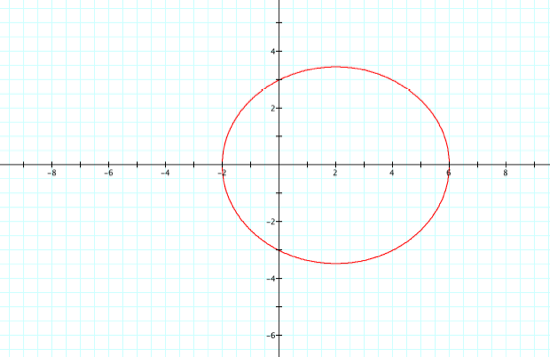
graph should make sense if you consider the denominator of the fraction. As q approaches either p/2 or 3p/2 the denominator
approach zero, and hence the entire fraction (r) will be very large. If our equation was ![]() , then
the denominator would be confined to values between, or including, 1 to 2. This implies that our r will range from
1 to ½ as seen below.
, then
the denominator would be confined to values between, or including, 1 to 2. This implies that our r will range from
1 to ½ as seen below.
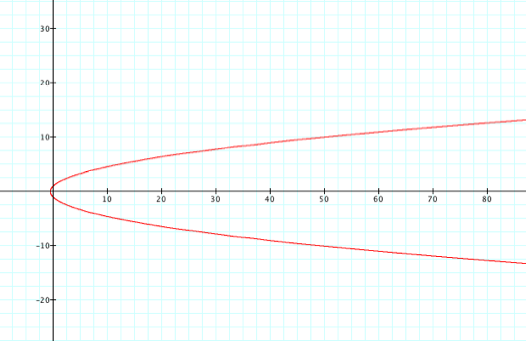
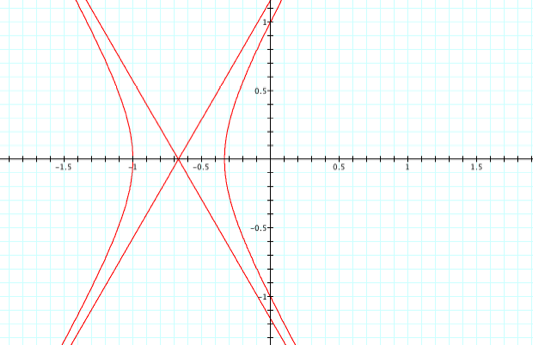
Changing
our equation to ![]() drastically changes the graph. Now the denominator is undefined when cos(q) = 1/2. Intuitively this should imply some
asymptotic behavior and indeed there is…
drastically changes the graph. Now the denominator is undefined when cos(q) = 1/2. Intuitively this should imply some
asymptotic behavior and indeed there is…
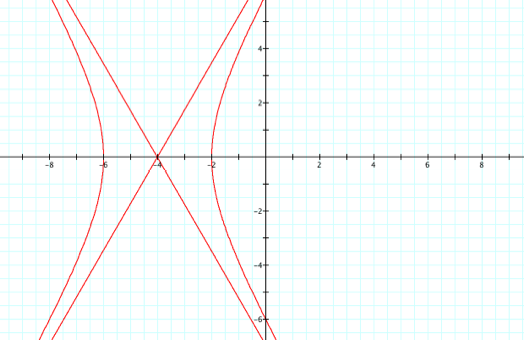
Enough
about the denominator, what about the numerator? Well, changing the numerator dilates the graph, notice the
scale:
![]()
![]()
![]()