Exploring Parametric Equations
By
Princess
Browne
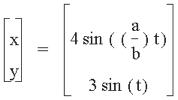
Investigation. Consider the
parametric equations
Graph these for
![]()
Describe fully. You may have to increase the
range of t for the larger
fractions. This class of parametric curves is called the Lissajous curves. Compare with
x = sin ((a) t)
y = sin
((b) t)
I
will start by graphing the parametric equation of x = sin ((a) t) and y = sin
((b) t). Next, I will graph the parametric equations of x = 4 sin((a/b)t) and y
= 3 sin(t). Finally, I will compare the different Lissajous curves.
When a=4, b=1
When a=5, b=1
When a=1, b=4
When a=1, b=5
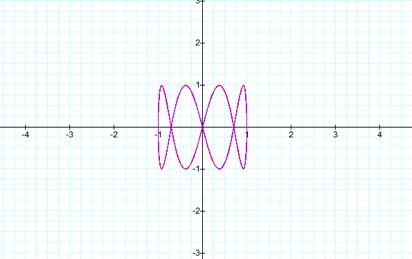
From the graphs above, we
will notice that when a > b the frequency of the curve is oriented around
the y-axis, and when a < b the frequency of the curve is oriented around the
x-axis. When a and b have common even or odd factors we cannot classify any
curves because the graph forms a straight line. The curve formed is determine
from the value of a/b. The amount of times the curve crosses the x-axis and the
y-axis are determine by the value of a/b. For instance, if a/b is 1/2, the
graphs will form a close curve along the x-axis. If a/b is 1/3 the graph will
form an open curve along the x-axis.
Next, we will look at the
following parametric equation:
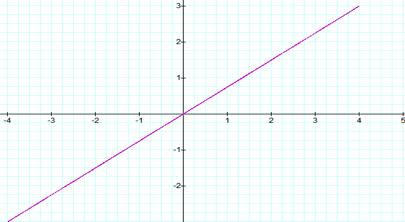
When a=b=1
When a=b we have a straight
line
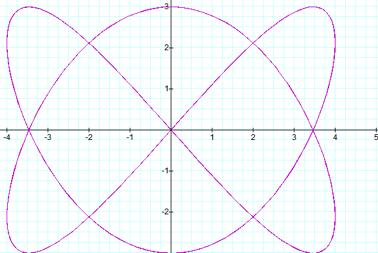
When a=1, b=2
When a=1 and b=2 we have a
bowtie
When a=1, b=4
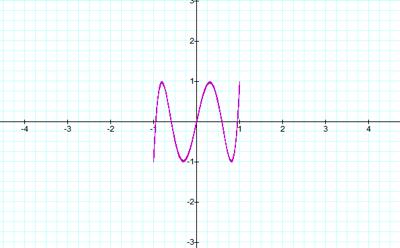
When a=2, b=3
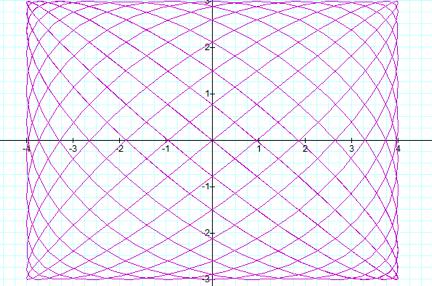
When a=12, b=13 (t-50 to 50)
From the following graphs, we
can conclude that the graph of parametric equations is dependent on the values
of a/b. The periods of the graphs are the same why the frequency for each graph
changes because the frequency depends upon the values of a/b.
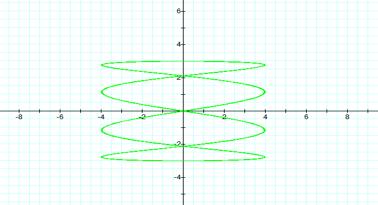
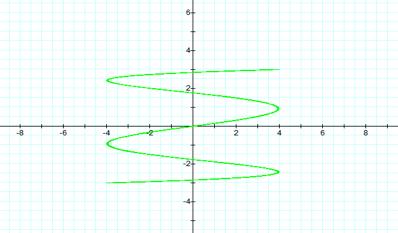
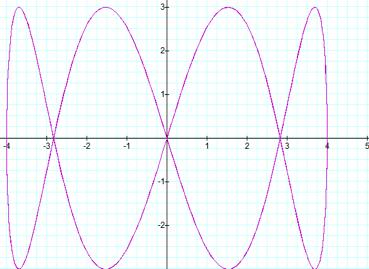
Using the parametric equations x = 4 sin ((a/b) t) and
y = 3 sin (t)
x = sin ((a)t) y = sin ((b)t)
When
we compare the graphs from the two equations; we will notice that there is a
difference between the graphs. The graphs of x = 4 sin((a/b)t) and y = 3 sin(t)
all have the same dimensions of (4,0), (-4,0), (0,3), and (0,-3). Whereas the
graphs for x = sin ((a) t) and y = sin ((b) t) dimensions depends on the value
of a. For instance when a< b we have the dimensions of (1,0), (-1,0), (0,1),
and (0,-1) and when a > b the dimensions ions are (4,0), (-4,0), (0,3), and
(0,-3).