
Exploring Exponents
By
Princess Browne
Graph x2
+ y2 = 1
x3
+ y3 = 1
x4
+ y4 = 1
x5
+ y5 = 1
What
do you expect for the graph of
X24
+ y24 = 1
Or
X25
+ y25 = 1
I will start by graphing the first four equations
above to find a pattern. From the given equations we will notice that the
equations are always equal to 1 and the exponents of x and y are equal in each
equation. These factors may be useful when we compare the different equations.
Graph 1
Purple ![]()
Graph 2
Purple ![]()
Red ![]()
Graph 3
Green ![]()
Graph 4
Green ![]()
Blue ![]()
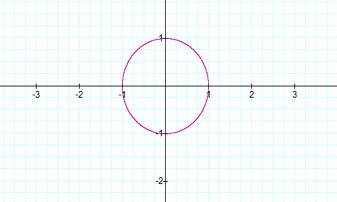
Graph number 1 represent the equation x2 +
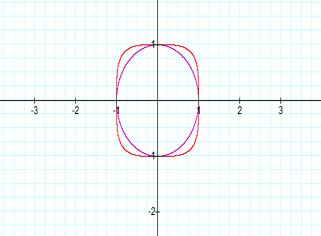
y2 = 1. As we can see this graph forms a circle. Graph number 2 is
the graph of x2 + y2 = 1 and x4 + y4
= 1. As we compare the two graphs we will see that the even number exponents
create a shape that starts of as a circle and as the exponents increases the
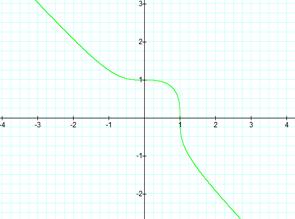
corners of the circle are extended out into a shape of a square. On the other
hand, graph number 3 represent the equation x3 + y3 = 1. This graph forms a line
with a curve in the middle. Graph number 4 is the graph of x3 + y3 = 1 and x5
+ y5 = 1. When we compare the two graphs we will notice that
as the odd exponent increases the curve in the middle of the graph extends to
form a square like shape. From the following equations and graphs I will guess
that the equations with the even exponents starts of as a circle and as the
exponents increases the graph will end up looking like a square shape.
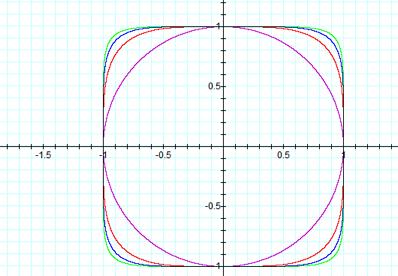
Next,
we will look at xn+yn=1. Let n equal all even numbers,
starting with 2 and increasing by 2.
We will graph n=2, n=4, n=6, and n=8. If we compare graph number 5 with
our previous graphs we will see that our hypothesis is true.
Graph 5
Purple ![]()
Red ![]()
Blue ![]()
Green ![]()
Graph
number 5 confirms our prediction that
when n is an even exponent the graph will form a circle and as n increases the corners of the circle
are extended to form a square shape. Next we will look at the equation when the
exponents are odd. If we look at xo+yo=1, where o stands
for all odd numbers starting with 3 and increasing by 2. We will graph the
functions of o=3, o=5, o=7, and o=9. Using the observation from our previous
graphs, we will hypothesize that the equations with odd exponents will start of
as a line with a curve or hump in the middle. As the exponent increases the curve would extend to from a
square shape.
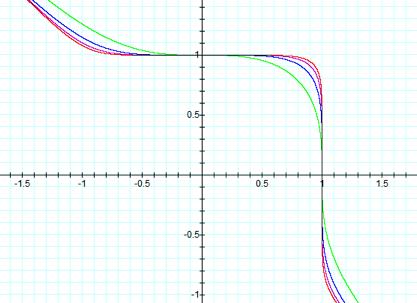
Graph 6
Green ![]()
Blue ![]()
Purple ![]()
Red ![]()
Graph
number 6 shows that as the odd exponent increases the middle of the line
changes from a curve shape to a square shape. If we compare the odd exponents
graphs with the even exponents graphs we can conclude that as the exponents
increases both graphs ends up with square like corners.
Now
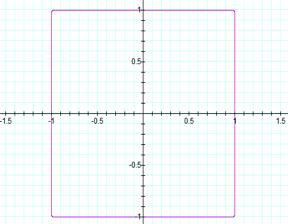
we will look at x24+y24 = 1 and x25+y25 =
1 to see if the following conclusions are true. Graph number 7 shows the graph
of x24+y24 = 1.
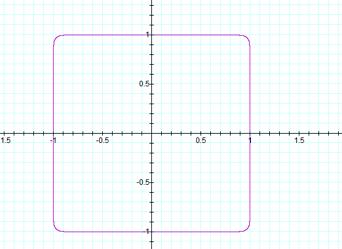
Graph 7
Purple ![]()
This
graph shows that our hypothesis is correct and that as the exponent increases
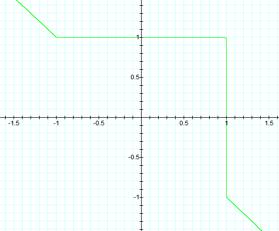
the corner of the graph extends to from the shape of square. Next, we will look
at the graph of x25+y25=1 to also prove our hypothesis
about the odd exponents.
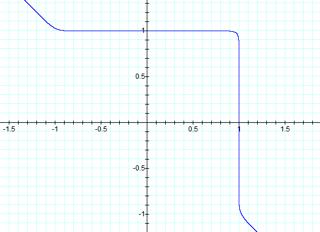
Graph 8
Blue ![]()
Graph
number 8 also shows that our assumption is correct. As the odd exponent increases,
the portion of the graph that is located in quadrant I forms a square like
shape.
Lets
try x100 + y100 = 1 and x101 + y101 = 1
x100 + y100
= 1
Graph looks like a
square!
x101 + y101
= 1
Middle looks like a
square also!