
Exploring Loci of Parabolas
By
Princess Browne
We will
look at the graph of y = ax2 + bx + c
(b is varied
and a and c are held constant)
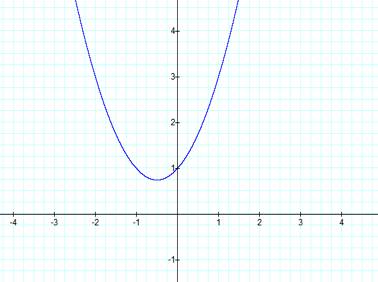
First, we will graph the equation where a, b, and c are
equal to 1.
Like any parabola the graph
is concave upward when a is positive. Therefore the graph will be concave
downward when a is negative. Because c = 1 the graph is not symmetrical around
the y-axis. The parabola passes through the points (0.1) because c = 1. When x
= 0, the graph would be symmetrical around the y-axis. Next, we will graph the
equation where b is varied and a and c remain 1.
![]()
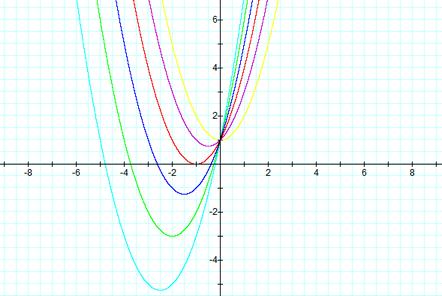
Yellow ![]()
Purple ![]()
Red ![]()
Blue ![]()
Green ![]()
Teal ![]()
The following graphs intersect
the y-axis at (0,1) because c = 1. The vertex is always left of the graph when
b is greater than 0. When b = 0 the vertex is on the x-axis. The real root of
the equation occurs where the parabola intersects the x-axis. The graph of y =
x2 + 2x + 1 have a real root because it intersect the x-axis. The
graph of y = x2 + 1x + 1 does not have any real root because it does
not intersect the x-axis. When b is positive the real roots occur on the
negative side of the y-axis.
Green ![]()
Purple ![]()
Red ![]()
Teal ![]()
Yellow ![]()
When b is negative the graphs intersect the y-axis at
(o,1). The vertex is to the right of the graph and the vertex is on the y-axis
when b = 0. The graph have no real root when b = -1.
_files/image002.jpg)
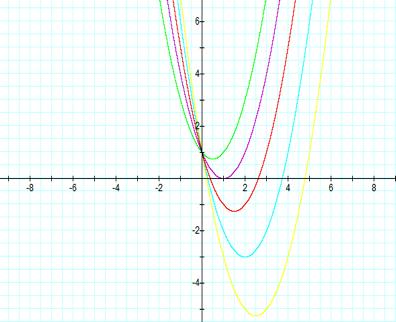
Purple y = x2 + 4x
+ 2
Red y
= 2x2 + 4x + 2
Blue y =
3x2 + 4x + 2
Green y = - x2 +
4x + 2
Teal y =
-2x2 + 4x + 2
Yellow y = -3x2 + 4x + 2
From the picture above, we can
conclude that each parabola passes through the point (0,2). When a is positive
the parabola is concave up and the parabola is concave down when a is negative.
The x-coordinate of the vertex is x = -b/2a.