
Parabolas
By Courtney
Cody
In this exploration, we will
look at various graphs that have a different value of d for the following function:
![]()
Let us start by looking at
the simplest case of the graph of ![]() when d=0. It is important to realize that
although d can take on any number,
it is always some numeric value and not a variable. Therefore, d is
a constant in the equation
when d=0. It is important to realize that
although d can take on any number,
it is always some numeric value and not a variable. Therefore, d is
a constant in the equation ![]() and we want to see how varying d changes the graph of this equation.
and we want to see how varying d changes the graph of this equation.
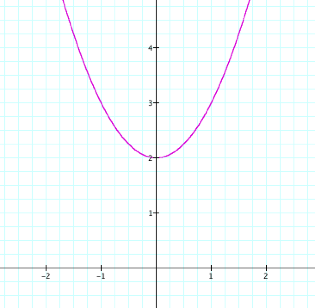
Graph A
![]()
Now, when d=0 the equation yields a parabola centered about the
y-axis and the vertex is at (0, 2), meaning the graph is shifted upward by 2
units. Also, the parabola opens
up. We should expect all equations
of the form ![]() to result in this same parabola, and the only change
will be determined by our value for d.
to result in this same parabola, and the only change
will be determined by our value for d.
To see the affect that
varying d has on the graph, let us
observe the following set of graphs, which contain several equations of the
form ![]() with positive values for d.
with positive values for d.
Graph B
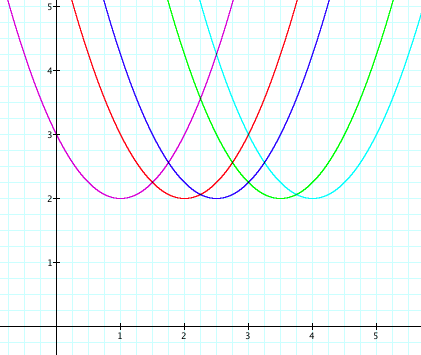
By only changing the value of
d in the equation![]() , the graph
appears to have moved to the right. The shape of the curve in Graph A has the exact same shape as the curves in Graph B. It
appears as though only the position of the curves has changed. Let’s examine the location of the
vertices for these different curves.
Looking at the purple curve, which has an equation of
, the graph
appears to have moved to the right. The shape of the curve in Graph A has the exact same shape as the curves in Graph B. It
appears as though only the position of the curves has changed. Let’s examine the location of the
vertices for these different curves.
Looking at the purple curve, which has an equation of ![]() , the vertex is
(1, 2). If we compare this to the
vertex of the curve in Graph A,
which has an equation of
, the vertex is
(1, 2). If we compare this to the
vertex of the curve in Graph A,
which has an equation of ![]() and a vertex of (0, 2), we notice that the x-value of
the vertex has increased from 0 to 1.
Now, if we look at the royal blue curve, which has an equation of
and a vertex of (0, 2), we notice that the x-value of
the vertex has increased from 0 to 1.
Now, if we look at the royal blue curve, which has an equation of ![]() , the vertex appears to be at (5/2, 2). Hence, as the value
of d gets larger, the parabola simply shifts further to the right. These values are precisely the values
of d in the corresponding
equations. Also, having fractional
values of d seems to have the same
affect as the positive integer values of d, which is the x-value of the vertex
is d.
, the vertex appears to be at (5/2, 2). Hence, as the value
of d gets larger, the parabola simply shifts further to the right. These values are precisely the values
of d in the corresponding
equations. Also, having fractional
values of d seems to have the same
affect as the positive integer values of d, which is the x-value of the vertex
is d.
Let’s see if this is true for
negative values of d.
Graph C
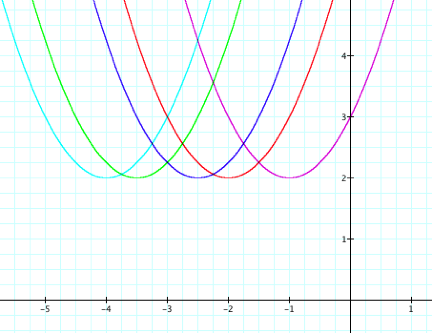
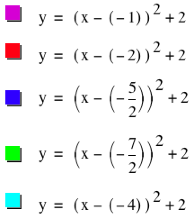
Now, by changing the value of
d in the equation![]() to be negative values, the graph appears to have moved to the left. The shapes of the curves in Graph C have the exact same shape as the curves in Graph A. Only
the position of the parabolas has changed and they have shifted to the left of
the y-axis. If we look at the
purple curve, which has an equation of
to be negative values, the graph appears to have moved to the left. The shapes of the curves in Graph C have the exact same shape as the curves in Graph A. Only
the position of the parabolas has changed and they have shifted to the left of
the y-axis. If we look at the
purple curve, which has an equation of![]() , the vertex is
(-1,2). Also, if we look at the
royal blue curve, which has an equation of
, the vertex is
(-1,2). Also, if we look at the
royal blue curve, which has an equation of![]() , the vertex is
(-5/2, 2). Hence, as the value of d gets smaller, the parabola simply shifts further to
the left.
, the vertex is
(-5/2, 2). Hence, as the value of d gets smaller, the parabola simply shifts further to
the left.
Thus, no matter what the
value of d is, the vertex of the
parabola with equation ![]() is always (d, 2). Furthermore,
the shape of the parabola is not affected by the value of d, only the location of the vertex is affected.
is always (d, 2). Furthermore,
the shape of the parabola is not affected by the value of d, only the location of the vertex is affected.