
Quadratics
in the xb-plane
By Courtney
Cody
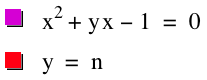
Consider the following
equation:
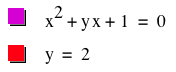
This equation is the special case
of the general quadratic equation ![]() , where a=1, c=1, and b
is some constant. In this
exploration, we will look at the effect b has on the equation
, where a=1, c=1, and b
is some constant. In this
exploration, we will look at the effect b has on the equation ![]() by studying the
graph of the equation and investigating what happens when the value b is varied.
Let’s start by graphing this equation in the xb-plane and seeing what we get. To graph in the xb-plane, we simply graph and substitute y in for b
so that now b becomes a
variable. Hence, we get the
following graph:
by studying the
graph of the equation and investigating what happens when the value b is varied.
Let’s start by graphing this equation in the xb-plane and seeing what we get. To graph in the xb-plane, we simply graph and substitute y in for b
so that now b becomes a
variable. Hence, we get the
following graph:
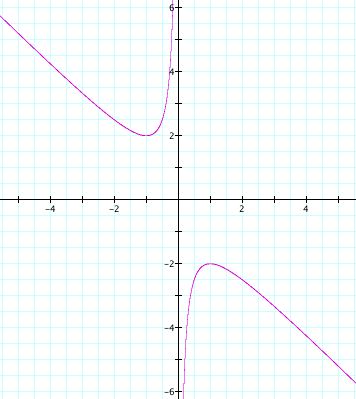
Graph A
![]()
When ![]() is graphed in the xb-plane, we notice that it is a hyperbola. If we take any particular value of b, say b =
4, and overlay this equation on the graph we are actually adding a line
parallel to the x-axis. This is because
we have allowed b to be an axis on
our graph. In particular, b is represented as the y-axis in our graphs. If this value of b
intersects the curve in the xb-plane
the intersection points correspond to the roots of the original equation for
that value of b. We have the following graph:
is graphed in the xb-plane, we notice that it is a hyperbola. If we take any particular value of b, say b =
4, and overlay this equation on the graph we are actually adding a line
parallel to the x-axis. This is because
we have allowed b to be an axis on
our graph. In particular, b is represented as the y-axis in our graphs. If this value of b
intersects the curve in the xb-plane
the intersection points correspond to the roots of the original equation for
that value of b. We have the following graph:
Graph B
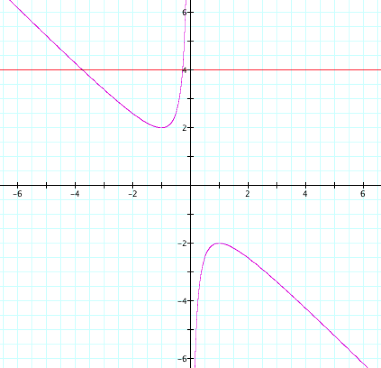
If we look at this graph, we
see that the red line, which represents b=4, intersects ![]() at two different points. What do these two intersections
represent? Since our graph is the
situation when b=4, then our
equation is
at two different points. What do these two intersections
represent? Since our graph is the
situation when b=4, then our
equation is ![]() . Algebraically,
if we solve for x using the quadratic formula, we get
. Algebraically,
if we solve for x using the quadratic formula, we get ![]() , or
, or ![]() and
and ![]() . These two values are the roots of
. These two values are the roots of ![]() . Now, if we
look at Graph B to see how these
two x-values relate, it appears as
though these are the x-values
where the intersections of
. Now, if we
look at Graph B to see how these
two x-values relate, it appears as
though these are the x-values
where the intersections of ![]() and
and ![]() occur. So does
this mean that that the intersection of
occur. So does
this mean that that the intersection of ![]() with a value of b represents the real roots of the original
equation? Let’s explore some more
values of b to see if this is
true!
with a value of b represents the real roots of the original
equation? Let’s explore some more
values of b to see if this is
true!
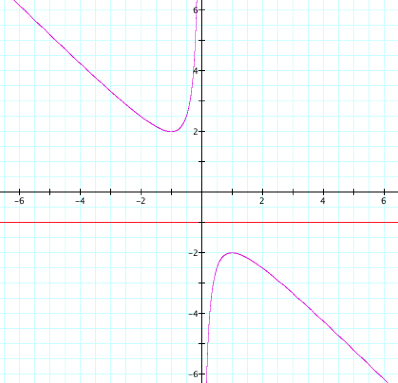
If we look at Graph B, it looks as though the vertex of the top curve of the
hyperbola appears to be at b=2. By letting b=2, we get the following graph:
Graph C
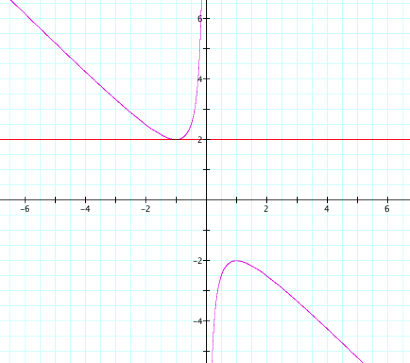
It appears that the line b=2 touches ![]() at one point. If we substitute b=2 into our equation to get
at one point. If we substitute b=2 into our equation to get ![]() and algebraically solve for x, we get
and algebraically solve for x, we get ![]() , or
, or ![]() . Once again,
. Once again,![]() is the root of
is the root of ![]() and is also the x-value where the intersection of the two curves in Graph
C occurs.
and is also the x-value where the intersection of the two curves in Graph
C occurs.
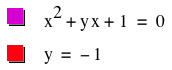
It is easy to see that if b=-4 and b=-2,
then similar results will be found because the bottom curve of the hyperbola
will be intersected by b=-4 in two
places and by b=-2 in two
places. But what about the area
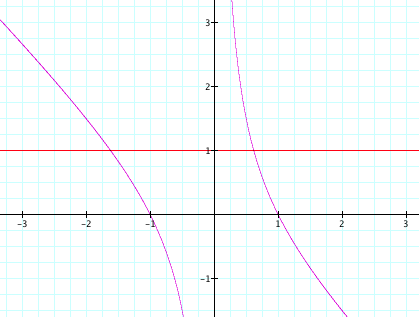
between these two curves of the hyperbola? What would happen if we let b=-1?
Let’s explore the graph of this situation!
Graph
D
Clearly, ![]() does not intersect
does not intersect ![]() at any points. So what does this mean
algebraically? Using the quadratic
formula, we get
at any points. So what does this mean
algebraically? Using the quadratic
formula, we get ![]() , which has only non-real roots. Hence, when
, which has only non-real roots. Hence, when ![]() there are no real roots.
there are no real roots.
It appears that for each
value of b we select, we get a
horizontal line that either does or does not intersect our equation ![]() . From Graphs
A-D, it is clear that on a single
graph we get the following:
. From Graphs
A-D, it is clear that on a single
graph we get the following:
·
Two negative real roots
of the original equation when b
> 2
·
One negative real root
when b = 2
·
No real roots for -2
< b < 2
·
One positive real root
when b = -2
·
Two positive real roots
when b < -2
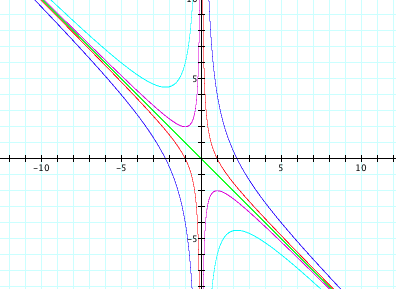
Consider the case when c = - 1 rather than + 1 in the equation ![]() . Let’s
graph other values of c on the xb-axis and explore the graph! Click the picture below for a movie!
. Let’s
graph other values of c on the xb-axis and explore the graph! Click the picture below for a movie!
Graph E
The moving red line in Graph
E represents all the different values
of b in the domain. If we look at the relationship between the
purple curve and the red line, we see that the red line always intersects the
purple curve in exactly two places.
Since in the previous graphs we discovered that the intersections
represented real roots of the quadratic equation, then we can check to see if
this is true. Using the quadratic
formula, we get ![]() , which will always have two real solutions since
, which will always have two real solutions since ![]() is always positive. Thus, when
is always positive. Thus, when ![]() ,
the equation
,
the equation ![]() always has two real roots for
all values of b.
always has two real roots for
all values of b.
Why is there a difference in
the number of solutions for when ![]() and
and ![]() ? Let’s graph
? Let’s graph ![]() for other values of c.
for other values of c.
Graph F
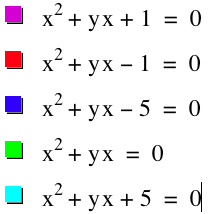
It appears that for each
value of c we select, we get a
hyperbola or a line. From Graph
F, it is clear that on a single graph
we get the following:
·
When ![]() , there
exists a b value such that there
are exactly two real roots, exactly one root, or no roots.
, there
exists a b value such that there
are exactly two real roots, exactly one root, or no roots.
·
When ![]() , the
equation
, the
equation ![]() is a straight
line and there are always exactly two real roots for all values of b.
is a straight
line and there are always exactly two real roots for all values of b.
·
When ![]() , the
equation
, the
equation ![]() is a hyperbola
and there are always exactly two real roots for all values of b.
is a hyperbola
and there are always exactly two real roots for all values of b.