
Spreadsheets
and the Fibonacci Sequence
By Courtney
Cody
In this assignment, I will explore the Fibonacci sequence using
spreadsheets. I will begin by generating
a Fibonacci sequence in the first column of a spreadsheet. Then I will explore the ratios of
different terms of the sequence.
Lastly, I will investigate the limit of the sequence when the starting
value is changed.
Let’s begin our investigation
on the Fibonacci sequence by defining what exactly such a sequence is. In mathematics, the following
recurrence relation defines the Fibonacci sequence:
![]()
![]()
![]()
Using our definition of the Fibonacci
sequence, we know that the first two terms are 1 and that each subsequent term
is the sum of the previous two terms.
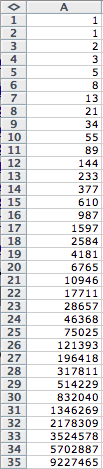
To generate a Fibonacci sequence in a spreadsheet, we will let the first
two entries of the first column be 1.
In all remaining cells of the first column, we will write a formula to
create the Fibonacci sequence, which is ![]() , where n is the value of each cell. Hence, the first column of our
spreadsheet is the first 35 terms of the Fibonacci sequence and appears as
follows:
, where n is the value of each cell. Hence, the first column of our
spreadsheet is the first 35 terms of the Fibonacci sequence and appears as
follows:
Suppose we wanted to
construct the ratio of each pair of adjacent terms in the Fibonacci
sequence. In order to find these
ratios, we want to use the formula ![]() . We will
construct these ratios in the second column of the spreadsheet.
. We will
construct these ratios in the second column of the spreadsheet.
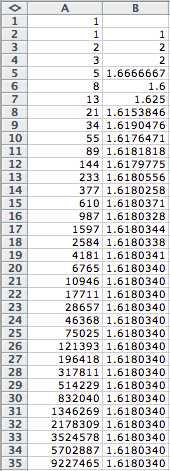
It appears as though as n
increases, the ratio of each pair of adjacent terms is converging to a
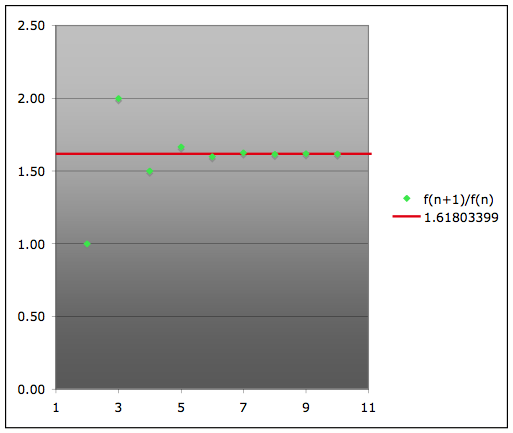
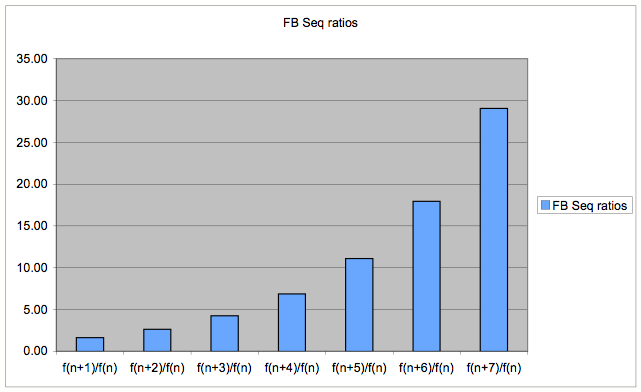
particular number. We have created
a chart of the ratios as n increases.
With each term of the series we observe a limiting characteristic. The value the sequence of ratios is
limiting to, 1.61803399…, is a very special number in mathematics. It’s called
the

Which is defined by ![]() .
.
Now we want to find the ratio
of every second term. Then we will
calculate the ratio ![]() for each term in
the Fibonacci sequence and place these values in the third column of the
spreadsheet.
for each term in
the Fibonacci sequence and place these values in the third column of the
spreadsheet.
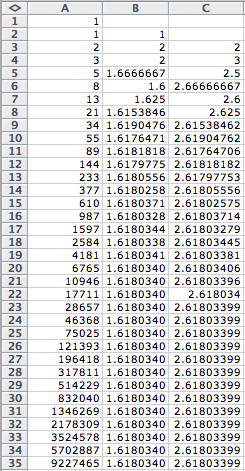
Once again, we see that the
ratios converge to a particular value.
If we compare the second and third columns of the spreadsheet, we notice
that for each entry in the third column, it is always exactly one more than the
value at each corresponding entry in the second column. So it we were to calculate the ratio of
every third term, should we expect that the value the ratios will converge to
be exactly two more than the value of each entry in the second column? Let’s investigate! What if we found the ratio of every
third term, fourth term, etc. Then
we would be looking at the ratios ![]() ,
, ![]() ,
, ![]() ,…. If we
calculate these ratios in the next several columns, we have the following:
,…. If we
calculate these ratios in the next several columns, we have the following:
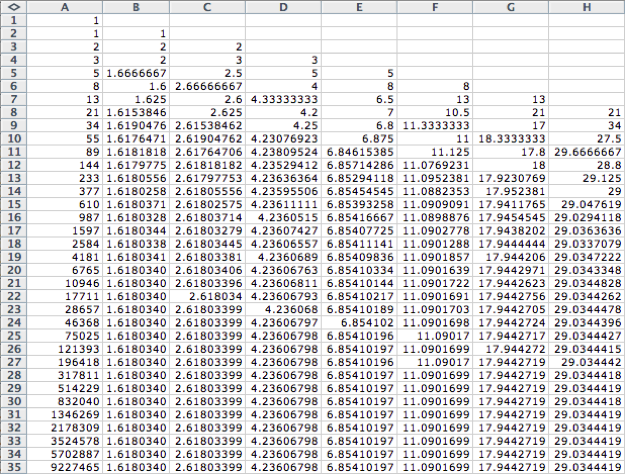
If we study each column, it is obvious that the ratios in each converge to some value. Is there anything special about these values? It is clear that the limit of each ratio does not increase by one each time. Instead, the numbers appear to grow exponentially. This observation is confirmed by creating a bar graph to show how the ratios increase.
Hence, the limiting ratios
are powers of the Golden Ratio, ![]() . Since the
limiting values increase exponentially, we can write a formula to calculate the
limiting ratio of various pairs of terms, which is
. Since the
limiting values increase exponentially, we can write a formula to calculate the
limiting ratio of various pairs of terms, which is
![]()
What if when we defined our
sequence we let f(0) and f(1) be some arbitrary integers other than 1? For instance, let f(0)=2 and
f(1)=5. Keeping all formulas in
the spreadsheet the same, we obtain the following:
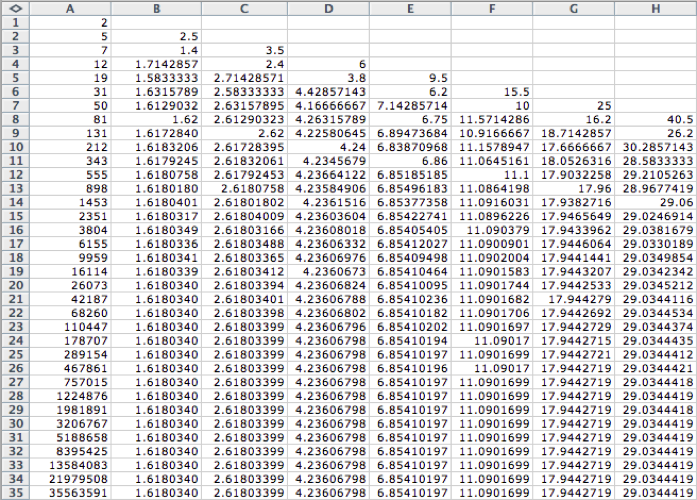
Like the Fibonacci sequence,
we see this new sequence has the same limit of the ratio of successive terms,
which are the powers of the Golden Ratio.
Let’s try another set of initial values, sat f(0)=2 and f(1)=1, which
define the Lucas Sequence. Hence,
we obtain the following spreadsheet representing the Lucas Sequence and the
ratios of different terms in the sequence:
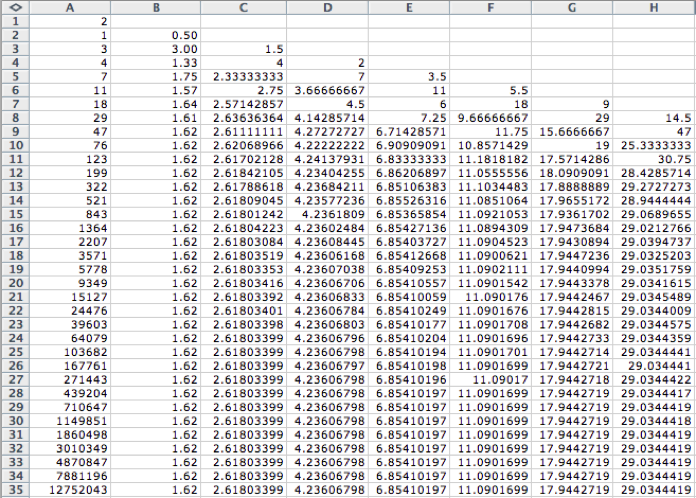
By studying the spreadsheet,
we see that the values in columns B through H for the Lucas sequence have the same
limit of the ratio of successive terms as the Fibonacci sequence, which are the
powers of the Golden Ratio. Thus,
we can infer from the spreadsheets that no matter what f(0) and f(1) are, if a
sequence is defined by ![]() , then the limit of the ratio of successive terms will always
be the powers of the Golden Ratio.
, then the limit of the ratio of successive terms will always
be the powers of the Golden Ratio.
Is there a relationship
between the Fibonacci sequence and the Lucas sequence? Let’s place the two sequences side by
side and compare the differences of these two sequences.
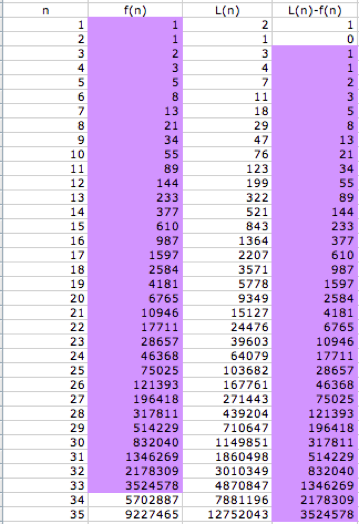
If we study the two purple
shaded regions, we see they are the same!
Hence, we have the formula ![]() , or
, or ![]() , which expresses the Lucas sequence in terms of the
Fibonacci sequence.
, which expresses the Lucas sequence in terms of the
Fibonacci sequence.
There exists another
interesting relationship between the Fibonacci sequence and the Lucas
sequence. What if we found the
sequence f(2n) and then found the ratio of f(2n) to f(n)?
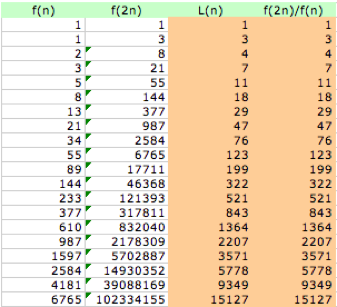
We notice in the spreadsheet
above that the aforementioned ratio is identical to the Lucas sequence! Hence, we have another formula ![]() , which expresses the Lucas sequence in terms of the
Fibonacci sequence.
, which expresses the Lucas sequence in terms of the
Fibonacci sequence.
Thus, a spreadsheet is a useful
tool for expressing and comparing number sequences, such as the Fibonacci and
Lucas sequences.