
Exploration of Sine Functions
by
Gayle Gilbert
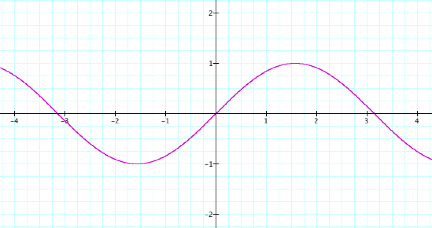
Let’s evaluate the graph of
y=a sin(bx+c) for different values of a, b, and c in order to determine how
different values of a, b, and c affect the graph. First, let’s evaluate the basic sine function, y=sin(x),
where a=1, b=1, c=0.
Now, let’s see how the graph
will change when we change the a value but keep b=1 and c=0 constant. Let’s graph a=1, a=2, a=-1,
a=½. Here’s the graph of
y=sin(x) (purple), y=2sin(x) (red), y=-sin(x) (blue), and y=½sin(x)
(green).
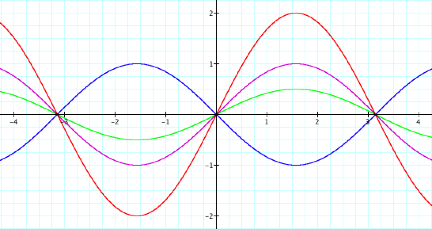
How does the graph change as
a changes? A seems to change the
maximum height of the graph. When
a=2, the maximum height of the graph is 2. When a=½, the maximum height is ½ on the
graph. When a is negative, it reflects the graph about the x-axis. We see here that the absolute value of
a is the amplitude of the sine graph.
Now, let’s look at how the
graph changes as the values of b change.
We will keep a=1 and c=0 constant, but we will let b=1, b=2, b=-1, and
b=½. Here’s the graph of y=sin(x) (purple), y=sin(2x) (red), y=sin(-x)
(blue), and y=½sin(x) (green).
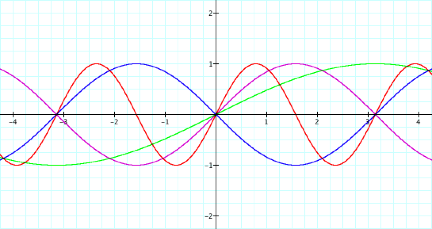
How does the graph change as
b changes? When b increases, it
seems to compress the sine function; when b increases, it seems to stretch the
sine function; when b is negative, it seems to reflect the sine function about
the x-axis. The period (how long
it takes for the graph to repeat itself) for the normal sine function (purple)
is 2*pi. When b=2, the period is
½(2*pi)=pi. When b=1/2, the
period is 2(2*pi)=4pi. The period is
two pi divided by the absolute value of b.
Now, let’s keep a=1 and b=1
constant but change the c value.
We’ll look at c=0, c=1, and c=-1.
Here’s the graph of y=sin(x) (purple), y=sin(x+1) (red), and y=sin(x-1)
(blue).
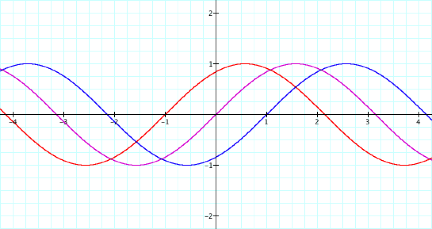
How does the graph change as c
changes? There is a phase shift to
the left when c is positive and a phase shift to the right when c is
negative. The phase shift is equal
to the -c/b.
How do you expect the graph
of y=2sin(2x+2) to look? Well, we
know the amplitude is 2, the period is 2pi/2=pi, and the phase shift is
-2/2=-1. From this information, we
have an idea of what the graph should look like. Let’s check.
Here, I’ve graphed the basic sine function y=sin(x) in purple with the
function y=2sin(2x+2) in green.
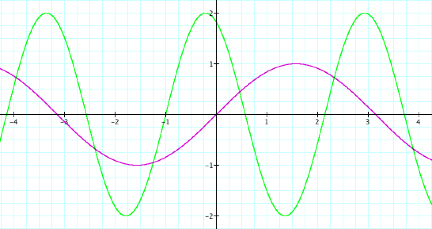
Notice, the amplitude is
a=absolute value(2)=2, the period is 1/2(2pi)=pi, and the phase shift is to the
left 1.
Let’s try another one. How would you expect the graph of
y=-sin(-x) to look? Well, since
a=-1, we are going to reflect the graph about the x-axis, and since b=-1, we
will reflect the graph about the x-axis again, so this should look the same as
y=sin(x). Let’s graph it to find
out.
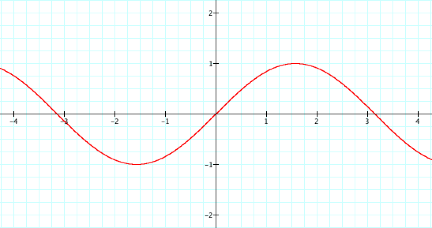
This is the same graph as the
original y=sin(x) function, so our investigative work seems to hold true.
Let’s try one more. How would expect the graph of
y=½sin(2x-1) to look? Well,
a=1/2, so we would expect the graph to have an amplitude of ½, b=2, so
we expect a period of 2*pi/2=pi, and c=-1, so we expect a phase shift of
–(-1/2)=1/2.
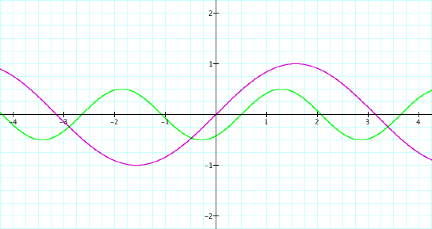
From the graph, we can see
that we are correct. The amplitude
is ½, the period is pi, and the phase shift is ½ to the right.
In conclusion, the amplitude
is the absolute value of a, the period is 2*pi/absolute value of b, and the
phase shift is –c/b.