|
The
Department of Mathematics and Science Education Allyson
Hallman |
|||||
|
|
|||||
|
Explorations
with Sine and Cosine |
|||||
|
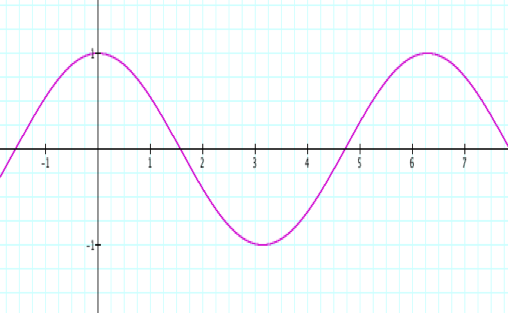
Consider the graphs of: |
|||||
|
|
|
||||
|
|
|
||||
|
It is easy to see that the sine graph is actually
the cosine graph shifted horizontally to the right by |
|||||
|
What kind of
transformations on these graphs can we produce? |
|||||
|
Part I: Multiply the functions by a constant a. What effect will this have on our graphs? |
|||||
|
So we shall consider the following two graphs where
values for a range from -5 to 5. Clicking on the graphs below will illustrate the
affect of varying values of a. A
second graph is included that has a
= 1 so that this graph may be compared with the graph where a varies. |
|||||
|
|
|
||||
|
|
|
||||
|
|
|
||||
|
We
have learned: Multiplying our function by
a constant affects the amplitude of each graph. Amplitude refers to the half the absolute value of difference
between value of the maximum and minimum. The absolute value of a is the amplitude of the curve. We know that y = sin x
and y = cos x have the same minimum and maximum values of -1 and
1, respectively (remember your unit circle). So the amplitude of these is 1. Notice that when a is negative, not only is the amplitude affected,
but also, the graph is reflected over the x-axis. We should certainly expect
this from our previous knowledge of transformations of functions. (We know
that –f(x) reflects our
graph over the x-axis.) Also, take note that the
zeros of the sine and cosine functions do not change for varying values of a. |
|||||
|
|
|||||
|
Part II: Multiply the functions’ x-variable by a constant b. What effect will this have on our graphs? |
|||||
|
So we shall consider the following two graphs where
values for b range from 0.25 to
2. Clicking on the graphs below will illustrate the
affect of varying values of b. Pictured below, b =1. Clicking these graphs will vary the values of b. |
|||||
|
|
|||||
|
|
|
||||
|
|
|
||||
|
|
|
||||
|
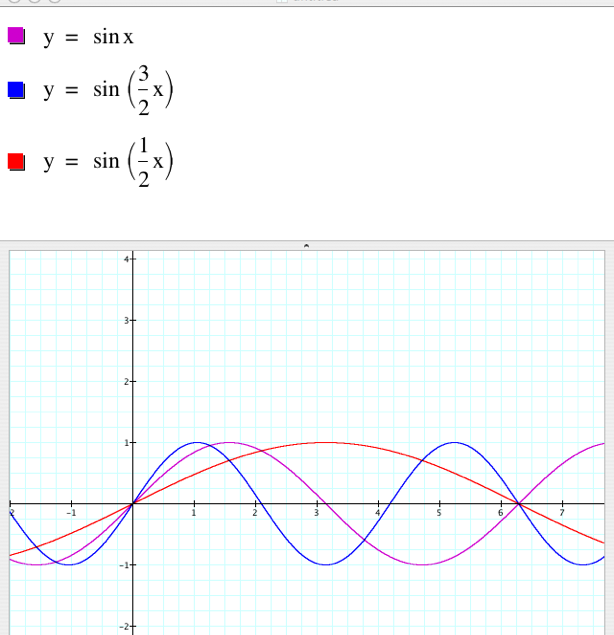
We
have learned: Multiplying the input of our function by a constant affects the period of
the each graph. The period of the graph is the distance required to progress through one
complete “wave” of the sine graph (also called wavelength for you physics
nuts). We can say the period is the distance between corresponding points on
the curve. For example the distance between the consecutive peaks on the
curve. We know from our work earlier with amplitude that maximum value of the
sine and cosine graph is 1. We also know that To understand more closely
the affect of b on the period of
the sine and cosine graph let’s consider two specific cases: |
|||||
|
|
|
|
|
||
|
|
|
|
|
||
|
|
|
||||
|
|
|
||||
|
Using our purple graphs
above as a base line, we can see that if b > 1 (the blue graphs), our period decreases and
if b < 1 (the red graphs) the period increases. |
|||||
|
|
|
||||
|
Restrict the domain of y = sin x
and y = cos x to [0, 2p] which produces one complete period. So taking into account
multiplying our input by b, we
have
Then dividing all sides by b, we have
|
|||||
|
Thus, the period of sine and cosine graphs is |
|||||
|
|
|
||||
|
Part III: Add a constant, c, to the input of our function. What effect will
this have on our graphs? |
|||||
|
So we shall consider the following two graphs where
values for c range from -5 to 5. Clicking on the graphs below will illustrate the
affect of varying values of c. A
second graph is included that has c
= 1 so that this graph may be compared with the graph where c varies. |
|||||
|
|
|
||||
|
|
|
||||
|
|
|||||
|
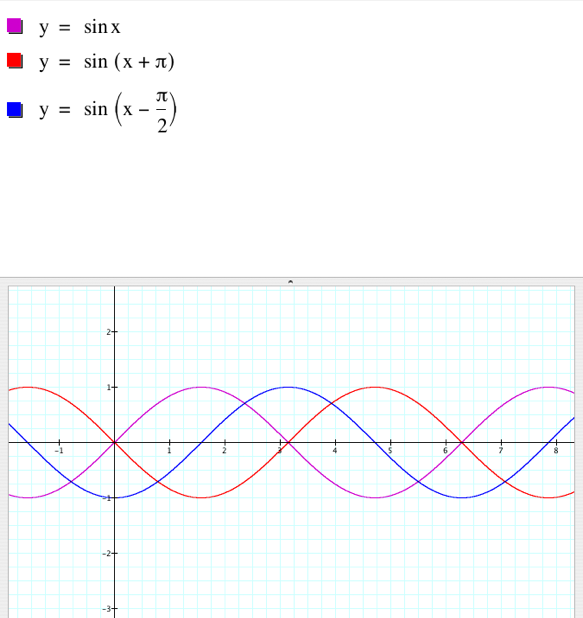
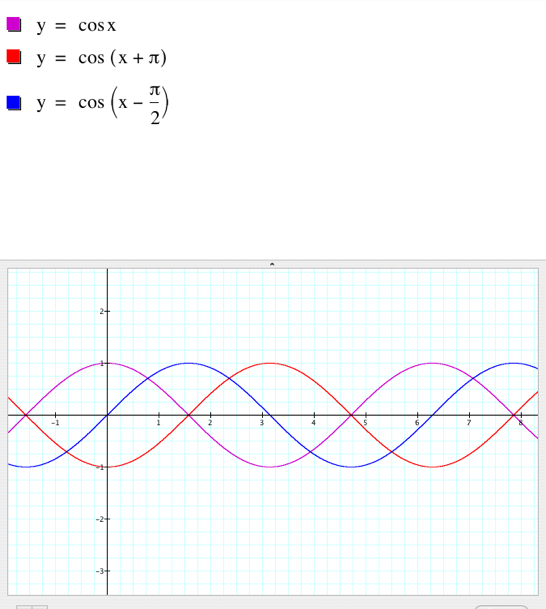
We
have learned: This is really quite
unsurprising. We know from our work with transformations that f (x + c) produces a horizontal shift; the graph shifts left
(red graphs) if c > 0 and
right (blue graphs) if c < 0,
as we can see below. |
|||||
|
|
|
||||
|
|
|
||||
|
|
|||||
|
There is some “coolness” going
on here. Sine and cosine are periodic functions and the period of each is 2p. So adding the period, or multiples of the period,
to the input will shift the graph so that it is identical to the original
graph of y = cos x or y =
sin x. Not convinced? Check this
out exploration in graphing calculator: If you vary the value of n manually by moving the dot on the bar (don’t press
play, it moves too fast) you can see the shifts for all multiples of p from -6 to 6. Notice that for all even values of n (all multiples of 2p) the graph is identical to the original parent
function y
= cos x. Also, as mentioned earlier,
the sine graph is simply the cosine graph shifted CLICK ON THE EQUATIONS BELOW
to explore these relationships in graphing calculator. Again, if you vary the
value of n manually by moving
the dot on the bar (don’t press play, it moves too fast) you can see the
shifts for all multiples of p from -10 to 10. Notice that for all even values of n (all multiples of 2p) the sin graph becomes identical to graph is
identical to the cosine graph and vice versa.
|
|||||
|
|
|||||
|
Things also become more
interesting if we consider b and c simultaneously.
|
|||||
|
For example, y = sin (2x
+ p) we would expect that sin
graph would be shifted by p, but as we can from the graphs below, y = sin (2x
+ p) is not shift by p. In fact it is shifted by |
|||||
|
y = sin
(2x + p) |
y = sin
(x + p) |
||||
|
|
|
||||
|
|
|
||||
|
Tying it all
together: A little conclusion |
|||||
|
|
|
||||
|
|
|
||||
|
|
|
||||
|
|
|||||
|
|
|||||
|
|
|||||
|
|
|||||
|
|
|||||
|
|
|||||
|
Some Special Phase Shifts: |
|||||
|
where k
is an integer. |
where k
is an integer. |
||||
|
|
|||||
|
|
|||||