|
|
||||
|
Department of
Mathematics and Science Education |
||||
|
|
|
|
|
|
|
|
Allyson Hallman |
|
||
|
|
|
|
|
|
|
Explorations with
Quadratics |
||||
|
|
|
|
|
|
|
Consider y
= ax2 + bx + c |
||||
|
|
|
|
|
|
|
Part
I: ‘a’ varies |
|
|
|
|
|
|
|
|
|
|
|
|
|
|||
|
|
|
|
|
|
|
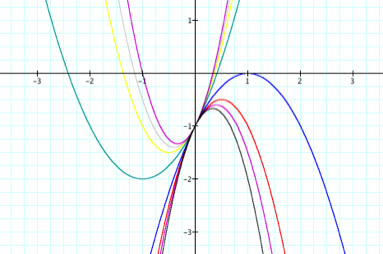
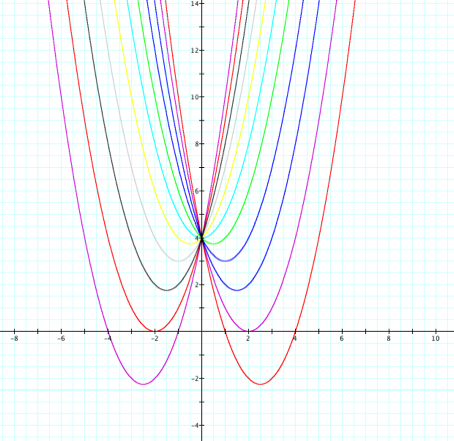
What happens? Two things should be
jumping out a you 1) Equations with negative values for a produce graphs that open down and equations with a
positive values for a produce
graphs that open up. 2) As the absolute value of a gets larger our graphs
become more narrow (they shoot towards positive or negative infinity faster).
This is more interesting than it might appear. If you consider the second
derivative of any quadratic it will be the a value. The second derivative represents
acceleration, so the larger the a value the faster the increase of velocity
and accordingly a quicker progression towards positive or negative infinity. Check this out in graphing calculator,
press play to vary the value of a from -20 to 20. Notice that when the value
of a approaches zero, the approximates a line, and of course when a is 0 we
have the line y = 2x – 1. |
||||
|
|
|
|
|
|
|
Part
II: ‘c’, the constant term varies |
|
|
||
|
|
|
|||
|
|
|
|
|
|
|
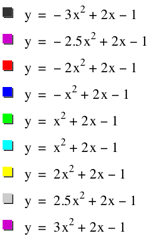
What happens? If this was really
surprising to you, you clearly were not paying attention when we covered
transformations of functions. (shame on you.) Remember that f(x) + c shifts our vertically c spaces. (if c > 0, shift up and if c
< 0, shift down.) So the actual parent graph in this case is y = x2
+ 2x. Notice also that c is
having some affect on the number of real roots we have. A quick with glance
without thinking might lead you to believe that c > 0 produces
no real roots, c < 0 produces two distinct real roots, and c = 0 produces one real (repeated) root or two roots
that aren’t distinct. But we can see from our graph that this is not case.
We’ll come back to the “root issue” later. |
||||
|
|
|
|
|
|
|
Part
III: ‘b’, the constant term varies |
|
|
||
|
|
|
|||
|
|
|
|
|
|
|
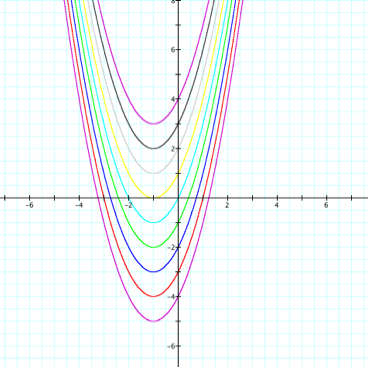
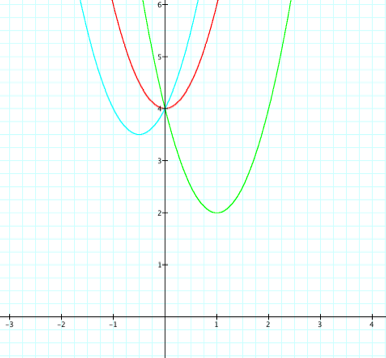
Well, gosh it sure is
pretty, but what does it all mean? The graphs appear to be
moving up and down and left and right. We must have done something wrong.
When we investigated c, we
discovered as c varied, our
graph shifted vertically. However, here the value of c is held constant at 4 but our graph is still
shifting vertically. Actually everything is as it should be. In our previous
investigation c was being added to
the same graph, y = x2 + 2x, whereas in this investigation the same c is being
added different graphs because the coefficient of the linear term is changing
each time. So rest assured, b is
not affecting the vertical shift. But surely, all of the graphs
having the same constant term of 4 will have some common affect. Speaking of
common, what do all of the graphs pictured have in common? That’s right the
y-intercept of 4, which certainly makes sense. Evaluating those (or any)
quadratic functions for 0 will always result in our constant term. And so c represents not only the vertical shift of the
parent function but also the y-intercept
of the parabola. So the only remaining
interesting thing happening is the horizontal shift, which is surely caused
by b. One might suppose that a
coefficient of -4 for the linear term of the quadratic would produce a
horizontal shift in the parabola of 4 units left. From our examples above, we
can see that this is not the case. Remember again from our knowledge of
transformations, that f(x + h)
produces horizontal shifts. The question then become how is coefficient of
the linear term of the quadratic affecting what is added to x? Let’s examine just a few examples to see what is
going on here. |
||||
|
|
|
|
|
|
|
|
|
|||
|
|
|
|
|
|
|
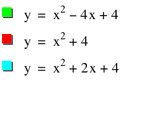
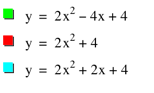
The red graph is our
original. Our foolishly wrong suspicion was that adding 2x would shift 2 spaces right and subtracting 4x would shift 4 places left. We can see from
examining the blue graph that in reality adding 2x shifted in 1 pace to the left and subtracting 4x shifted our graph 2 spaces right. So in fact the
shift is half of what we supposed and in the opposite direction. That’s not
so shocking. Remember again that f(x + h)
produces horizontal shifts to the right if that h < 0 and to
the left if h > 0. But why is dividing by 2?
Will this always be the case? Consider the following: |
||||
|
|
|
|||
|
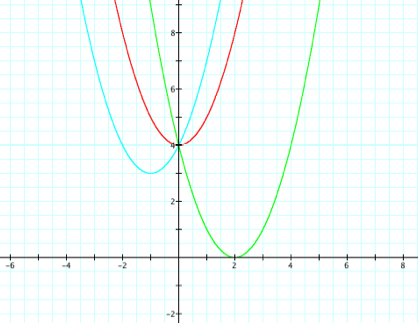
Now with an a = 2, we can see that blue graph is not shifted left one
space, but left 0.5 of a space, or a fourth of what we originally thought.
Likewise, instead of shifting 2 spaces right our green graph is 1 space to
the right. What is going on here? It seems that both a and b
have affect on the horizontal shift of the graph. Let’s return to our
original equation and use some algebra skills to determine what’s happening. |
||||
|
|
|
|
|
|
|
|
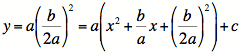
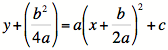
Original equation Factor out a. Complete the square by
adding half the linear term squared to both sides. Factoring the perfect
square trinomial you just created into a binomial squared. Solving for y. |
|||
|
|
|
|
|
|
|
Now it is pretty easy to
see that when varying all the coefficients together there is interaction
among them. Both a and b contribute to the horizontal shift and a, b,
and c contribute to the vertical
shift. Specifically, the vertical shift is |
|
|||
|
|
|
|
|
|
|
What? The roots, oh yes, I did
mention we’d talk about those later. Well, in reality this is something you
already know. Remember the quadratic formula |
||||
|
|
||||