
Tiffany N. Keys’ Assignment 1:
All
About Sines
The
graphs of all sine functions are related to the graph of y = sinx
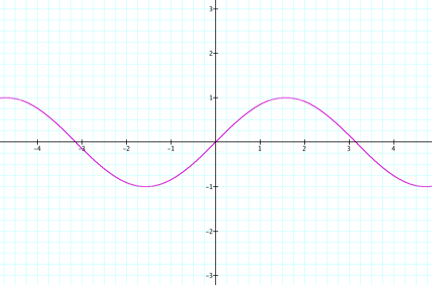
This
graph has the following characteristics:
§
The
domain of the function is all real
numbers.
§
The
range of the function is -1 < y <
1 or [-1, 1]
§
The
function is periodic, meaning that its graph has a repeating pattern that
goes on indefinitely.
§
The
shortest repeating portion of the pattern is called a cycle
and the horizontal length of each cycle is the period.
§
The
amplitude of the function is half the
vertical distance between its minimum and its maximum value.
INVESTIGATION: Examine graphs of y = a sin (bx +c) for
different values of a, b, and c.
First,
let’s begin with substituting in values for a:
Y = sin(x) y = 2 sin(x) y = 3 sin(x)
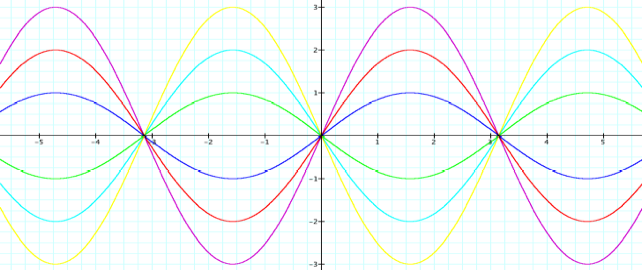
Y =
-sin(x) y = -2 sin(x) y = -3 sin(x)
OBSERVATIONS:
·
The
graph of each function passes through the origin, (0,0).
·
Each
graph is continuous along the x-axis and appears to repeat itself once it
reaches a certain point on the x-axis.
·
The
domain of all the graphs is all real numbers, however they reach have different
ranges.
They are as follows:
Y = sin(x), [-1, 1] Y = -sin(x), [-1,1]
y = 2 sin(x) , [-2, 2] y = -2 sin(x), [-2,2]
y = 3
sin(x), [-3, 3] y =
-3 sin(x), [-3,3]
·
The
amplitude of the graph is affected when the value of a
is changed. When a > 1, the slope of the
graph to appears to be more steep.
When a < 1, the magnitude of the
amplitude is the absolute value of a and the
graph is reflected across the x-axis.
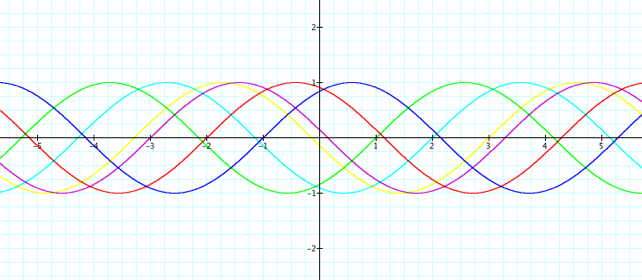
Next,
let’s observe what happens when different values for b
are substituted in:
Y = sin(x) y = sin(2x) y = sin(3x)

Y =
sin(-x) y = sin(-2x) y = sin(-3x)
OBSERVATIONS:
·
Like
the graphs of each function above, these also pass through the origin, (0,0).
·
They
are also continuous along the x-axis and appear to repeat themselves once they
reach a certain point on the x-axis.
·
The
domain of all the graphs is all real numbers and they all have the same range
of [-1, 1].
·
When
b is
changed in the function, the period is effected. When b
> 1, the graph squeezes and the period becomes shorter. When b <
1, the periods stayed the same and, like when a was assigned a negative value,
the graph is reflected across the x-axis.
Lastly,
let’s notice the difference in the graph when values for c are substituted in:
Y = sin(x
+ 1) y = sin(x + 2) y = sin(x + 3)
Y =
sin(x - 1) y = sin(x - 2) y = sin(x - 3)
OBSERVATIONS:
·
Unlike
the graphs above, these graphs do not pass through the origin.
·
They
are, however, continuous along the x-axis and repeat themselves once they reach
a certain point on the x-axis.
·
The
domain of all the graphs is all real numbers and they all have the same range
of [-1, 1].
·
The
part of the graphs that are effected when the c value
is changed in the function is the phase shift, which is the graph’s movement
along the horizontal axis. When c > 1, the graph moves to the right along
the x-axis and when
c < 1, the phase shift is toward the left
along the x-axis.