
Tiffany N. Keys’ Assignment 10:
Parametric
Curves
A
parametric curve in the plane is a pair of functions where the two functions
are the ordered pairs (x,y).
x
= f(t)
y
= g(t)
EXPLORATION: For
various a and
b,
investigate x = cos (at)
y
= sin (bt) from 0 < t <
2P
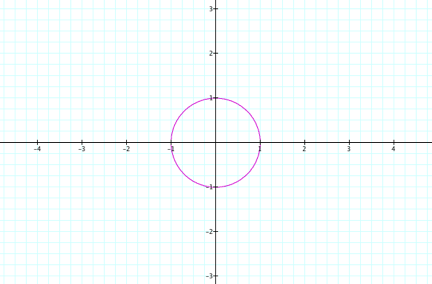
Let’s
graph the functions where a = 1 and b = 1: x
= cos (at)
y
= sin (bt) from
0 < t < 2P
Let’s
see what happens when different values for b
are substituted in the equation.
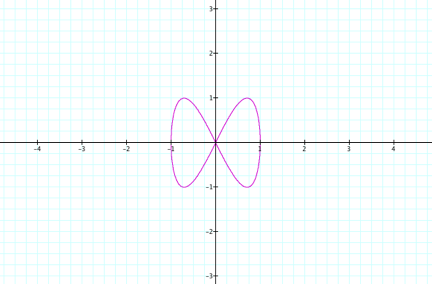
When
a = 1 and b = 2, the following graph is obtained:
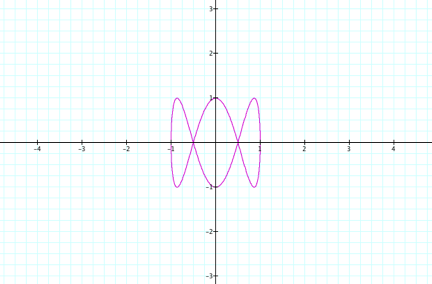
When
a = 1 and b = 3, the following graph is obtained:
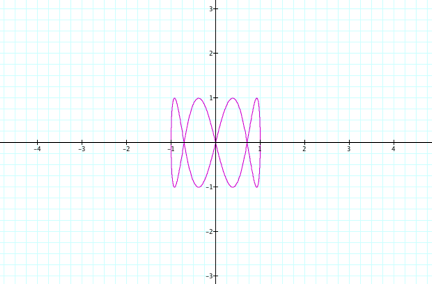
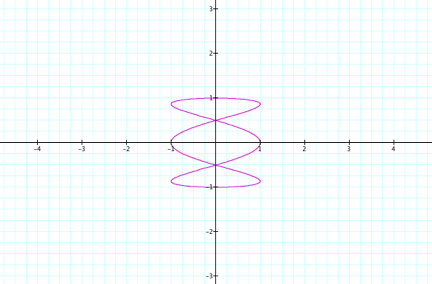
When
a = 1 and b = 4, the following graph is obtained:
OBSERVATIONS:
·
It
appears that as the value of b is increased the number of curves increased that
appear along the x-axis.
Now,
let’s see what happens when different values for a
are substituted in the equation.
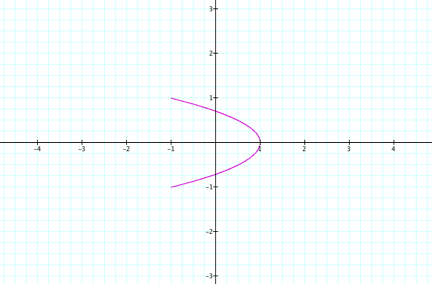
When
a = 2 and b = 1, the following graph is obtained:
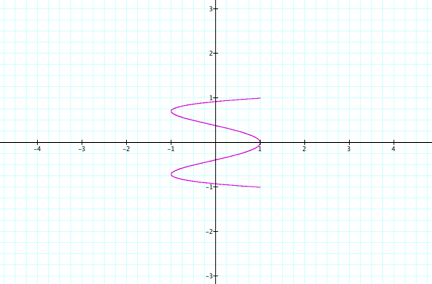
When
a = 3 and b = 1, the following graph is obtained:
When
a = 4 and b = 1, the following graph is obtained:
OBSERVATIONS:
·
It
appears that as the value of a is increased the number of curves don’t
necessarily increase.
·
When
a has an even value, the curves appear to not be complete or as if the graph is
incomplete.
·
However,
when a has an odd value, the number of curves is equal to the value of a and
they extend along the y-axis instead of the x-axis.
What
will happen if both the value for a and b were changed?
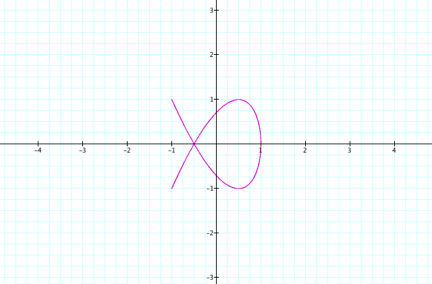
When
a = 2 and b = 3, the following graph is obtained:
When
a = 3 and b = 4, the following graph is obtained:
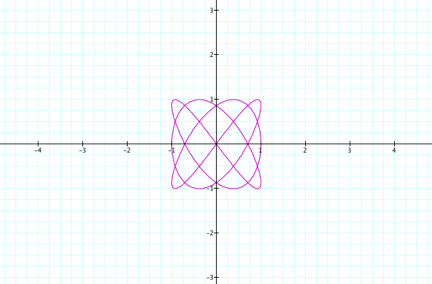
OBSERVATIONS:
·
It
appears that the curves are created along the x- and the y-axis.