
Tiffany N. Keys’
Assignment
12:
Altitude
of a Hot-Air Balloon
An
Exploration using Microsoft Excel
Construct
a graph of any function y = f(x) by generating a table of values with the x
values in one column and the y values in another.
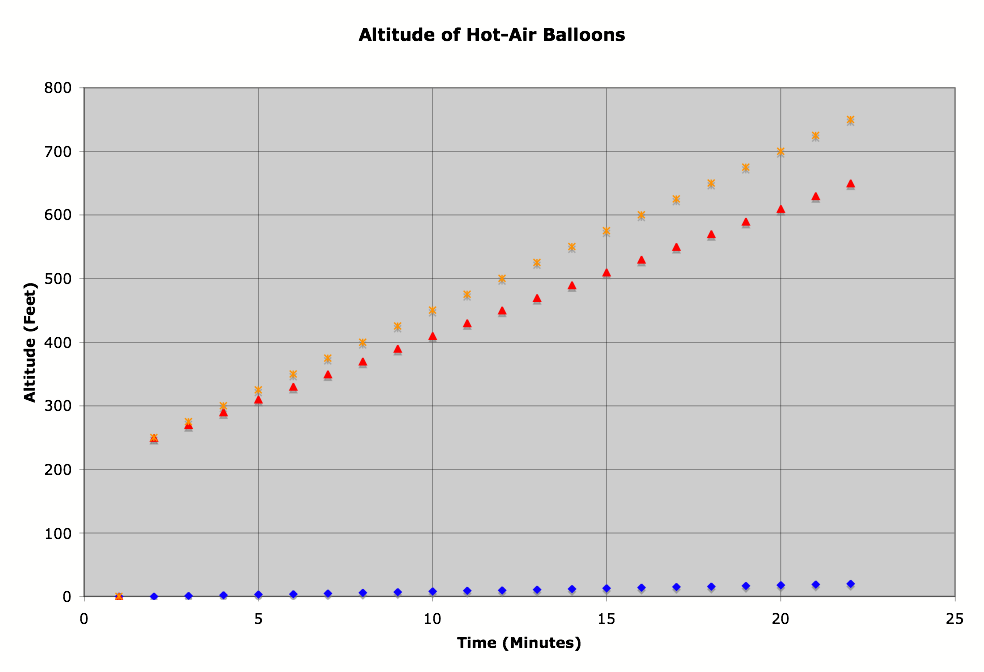
Elise
is at an altitude of 250 feet in a See-The-World hot-air balloon. She turns on
the burner and the balloon rises at a rate of 20 feet per minute for 20
minutes. Her altitude h after you have risen for t minutes is given by
the function
h = 250 + 20t, where 0 < t < 20 (or y = 20x +
250)
Rodney
is at an altitude of 250 feet in a Capture-The-View hot-air balloon. He turns
on the burner and the balloon rises at a rate of 25 feet per minute for 20
minutes. His altitude h after you have risen for t minutes is given by
the function
h = 250 + 25t, where 0 < t < 25 (or y = 25x +
250)
Let’s
enter these functions into Excel to see how they would be represented
graphically.
|
Time (minutes) |
See-The-World Balloon |
Capture-The-View |
|||
|
0 |
|
250 |
|
250 |
|
|
1 |
|
270 |
|
275 |
|
|
2 |
|
290 |
|
300 |
|
|
3 |
|
310 |
|
325 |
|
|
4 |
|
330 |
|
350 |
|
|
5 |
|
350 |
|
375 |
|
|
6 |
|
370 |
|
400 |
|
|
7 |
|
390 |
|
425 |
|
|
8 |
|
410 |
|
450 |
|
|
9 |
|
430 |
|
475 |
|
|
10 |
|
450 |
|
500 |
|
|
11 |
|
470 |
|
525 |
|
|
12 |
|
490 |
|
550 |
|
|
13 |
|
510 |
|
575 |
|
|
14 |
|
530 |
|
600 |
|
|
15 |
|
550 |
|
625 |
|
|
16 |
|
570 |
|
650 |
|
|
17 |
|
590 |
|
675 |
|
|
18 |
|
610 |
|
700 |
|
|
19 |
|
630 |
|
725 |
|
|
20 |
|
650 |
|
750 |
|
PORPOSED
QUESTIONS:
·
From
the graph of the functions, can we conclude which balloon would reach 1000 feet
the fastest?
·
Can
we use the graph of the functions to figure out how long it would take for each
balloon to reach 1000 feet?
·
What
other conclusions can be made from the graph?