
Tiffany N. Keys’ Assignment 2:
Look at
that Parabola!
A quadratic function has the form y = ax2
+ bx +c, where a is not equal to zero. The U-shaped graph of a
quadratic function is called a parabola. The
graphs of all quadratic functions are related to the graphs y = x2 and
y = - x2
y = x2 y = - x2
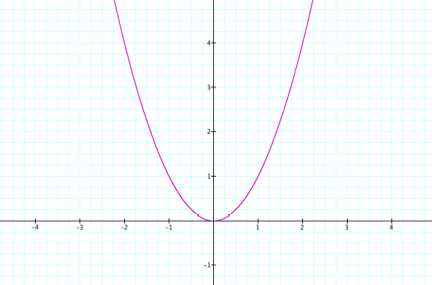
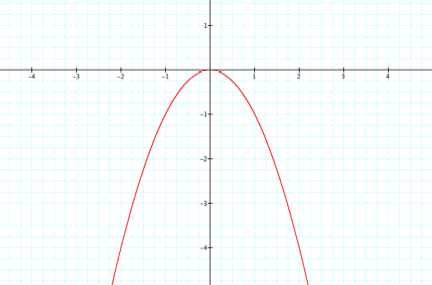
These
graphs have the following characteristics:
§
The
origin is the lowest point on the
graph of y = x2 and the highest point of the graph of y = -x2
§
The
lowest point or the highest point on the graph of a quadratic function is
called the vertex.
§
The
axis of symmetry for the graph of a
quadratic function is the vertical line through the vertex. The graphs above
are both symmetric about the axis of symmetry or, in these cases, the y –
axis.
INVESTIGATION: Construct graphs for the parabola y = ax2
+ bx +c for different
values of a, b, and c.
First,
let’s begin with substituting in values for a:
Y = 3x2 y = 2x2 y = x2
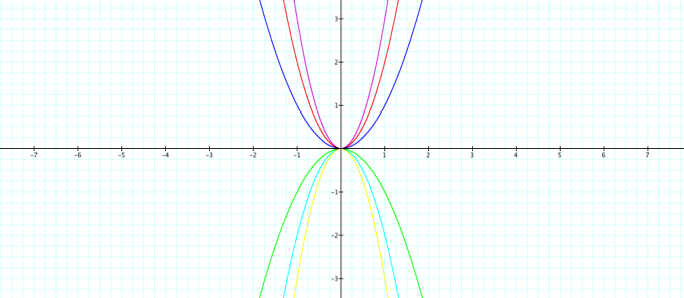
Y =
-3x2 y = -2x2 y = -x2
OBSERVATIONS:
·
The
parabola always passes through the origin.
·
The
coordinates of the vertex of the parabola do not change in each equation as
different values for a are substituted in.
·
The
concavity of the parabola is the aspect of the graph changes in each equation.
As a increases, the concavity of the parabola
decreases. If a is negative, then it is
reflected across the x-axis.
Next,
let’s observe what happens when different values for b
are substituted in:
Y = x2+3x y = x2+2x y = x2 + x
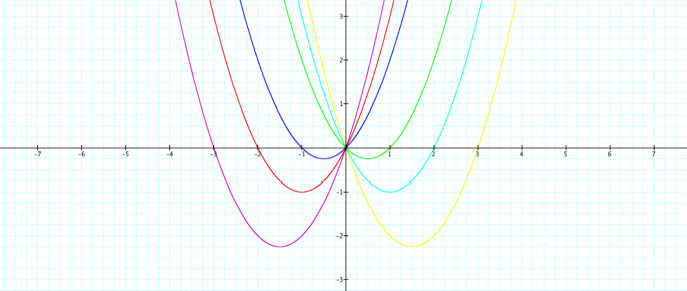
Y = x2-
3x y = x2- 2x y = x2 - x
OBSERVATIONS:
·
As
above, the parabola always passes through the origin.
·
However,
the coordinates of the vertex of the parabola are the aspect of the graph that
changes in each equation. As b increases, the
vertex shifts across the x-axis. If b is
negative, then it reflected across the y-axis.
·
The
concavity of each parabola does not change in each equation as different values
of b are substituted in.
Lastly,
let’s notice the difference in the graph when values for c are substituted in:
Y = x2+ x + 3 y = x2 + x + 2 y = x2 + x + 1
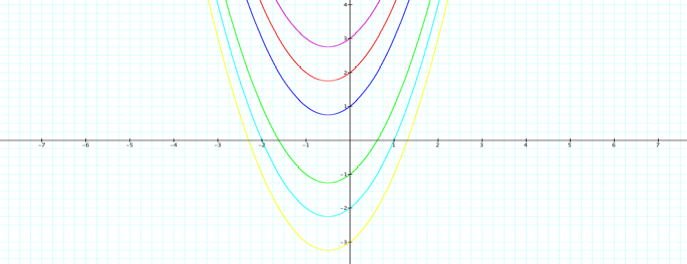
Y = x2+ x - 3 y = x2 + x - 2 y = x2 + x - 1
OBSERVATIONS:
·
The
parabola does not pass through the same point as c
changes.
- The coordinates
of the vertex of the parabola are the aspect of the graph that changes in
each equation. As c increases, the
vertex, depending on if c is positive or
negative, moves up or down along the y-axis.
- The concavity of
the parabola is another aspect of the graph changes in each equation. As c increases, the concavity of the parabola
increases.