
Problem Statement:
Graph x2 + y2 = 1, x3 + y3
= 1, x4 + y4 = 1, and x5 + y5 =
1. What do you expect for x24
+ y24 = 1 and x25 + y25 = 1?
by Laura Lowe
I
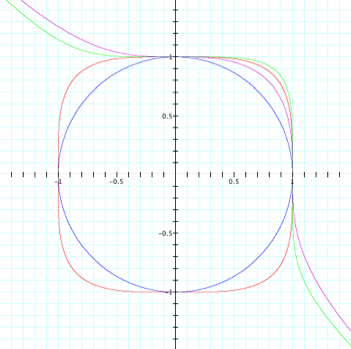
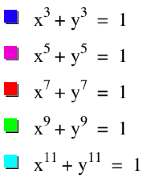
began by graphing the 4 relations as shown below.
|
|
|
I
can immediately see that there is a relationship between graphs of the red and
blue functions and those of the purple and green functions. When I look
at the equations of those graphs, it becomes clear that there is likely some
kind of relationship involving odd and even exponents. It appears upon my initial examination
that the relations with even exponents have a circular shape. In fact the first relation, x2
+ y2 = 1 is a circle with radius 1 centered at the origin, as we
should have expected from the equation.
However, the next even powered relation, x4 + y4 =
1 also has a circular shape, but with the corners extended out to look more
like a square. This relation
also has a radius of 1 along the x-axis and the y-axis, but nowhere else. I can also see that the relations with
the odd exponents look like the line y = -x with a ”bump” out into Quadrant
I. That “bump” has a
circular appearance in x3 + y3 = 1, but appears more
square.
From
this I can establish an initial hypothesis that the equations of the form xn
+ yn = 1 will, when n is even, have a circular appearance that
becomes more like a square as the exponents become larger, and, when n is odd,
look like the line y = -x, but with a “bump” into Quadrant I that also becomes
more square in shape as the exponents become larger.
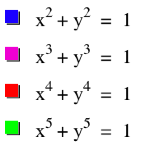
In
order to further investigate this relationship, I graphed the function xn
+ yn = 1 where n = 2, 4, 6, 8, and 10.
|
|
|

From these graphs I can see
my hypothesis holds true. The
graphs of xn
+ yn = 1, when n is even, look like a circle with the corners
gradually being dragged outward into a square shape as we increase n. Click
here to see an animation.
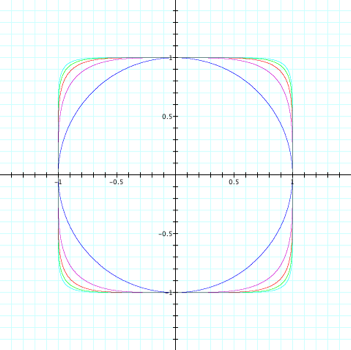
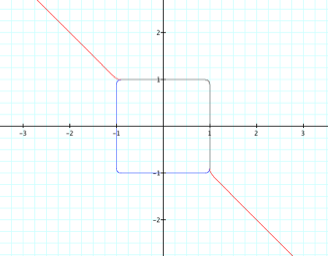
Similarly,
I graphed the function xn + yn = 1 where n = 3, 5, 7, 9,
and 11.
|
|
|
Again I can see my hypothesis
holds true. The graphs of xn + yn
= 1, when n is odd, look like the line y = -x with a “bump” into Quadrant I
that becomes more square in shape as we increase n. Click here to see an
animation.
So
I expect that x24 + y24 = 1 and x25 + y25 = 1 will have the same
characteristics. When I graph
them,
I
can see that my hypothesis was correct. I will leave it up to you to decide which graph is
which.
Extensions:
Why
doesn’t xn + yn = 1 have any points in Quadrant III when
n is odd?
What
if we were to graph y = xn?
Could we expect to see a similar pattern?
What
about x = yn?
What
should we expect to see if we let n grow infinitely large?