
Exploring Polar Equations
By Mary
Negley
For
this write-up, I will investigate the following equations with different values
of p:
a)![]() b)
b)![]()
c)![]() d)
d)![]()
for ![]() ,
, ![]() , and
, and![]() .
.
First
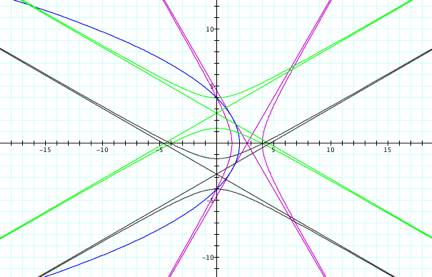
I would like to look at the graphs when p and k both equal 2.
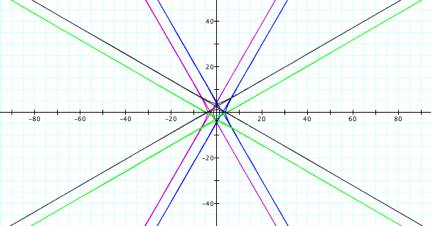
Equation a) is fuschia, equation b) is blue, equation
c) is green and equation d) is black.
Each equation appears to comprise two straight lines, which intersect on
one of the axes. The two equations
that contain cosine each intersect on the ![]() -axis with the one that contains
-axis with the one that contains ![]() on the left of
the origin and the one that contains
on the left of
the origin and the one that contains ![]() on the right of
the origin. The two equations that
contain sine each intersect on the y-axis
with the one that contains
on the right of
the origin. The two equations that
contain sine each intersect on the y-axis
with the one that contains ![]() below the origin
and the one that contains
below the origin
and the one that contains ![]() above the
origin.
above the
origin.
I believe that were I to zoom in on the above grid,
then I would gain a better understanding of the relationship among the
equations.
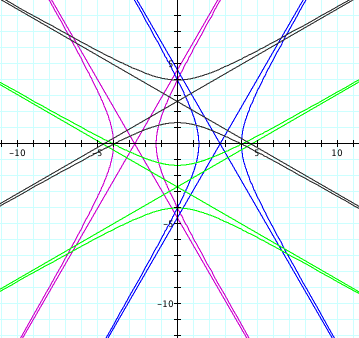
Now if ![]() and
and ![]() , the following graphs occur:
, the following graphs occur:
These graphs appear to be very similar to the previous
graphs, but that is only because I zoomed in more on this graph. Notice that the first equation is
centered at an x-value of about
-1.3, the second equation is centered at an x-value of about 1.3, the third equation is centered at
a y-value of about -1.3 and the
fourth equation is centered at a y-value
of about 1.3. These graphs
together are symmetrical over the y-axis
and over the x-axis. The overall shape of these graphs is
the same as the previous graphs.
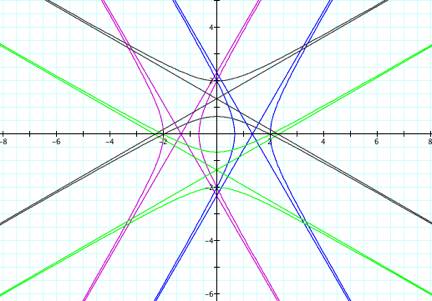
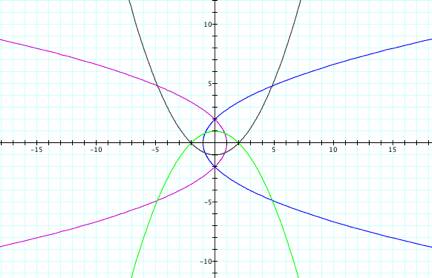
Now how does that compare to the graphs if ![]() and
and ![]() ?
?
These
graphs have a very different shape from the previous two grids. It comprises four parabola-like
shapes. The first one opens right
and has its left-most point at ![]() . The second one
opens left and has its right-most point at
. The second one
opens left and has its right-most point at ![]() . The third one
opens up and has its minimum at
. The third one
opens up and has its minimum at ![]() . The fourth one
opens down and has its minimum at
. The fourth one
opens down and has its minimum at ![]() . The
graphs are still symmetrical over the y-axis and over the x-axis.
. The
graphs are still symmetrical over the y-axis and over the x-axis.
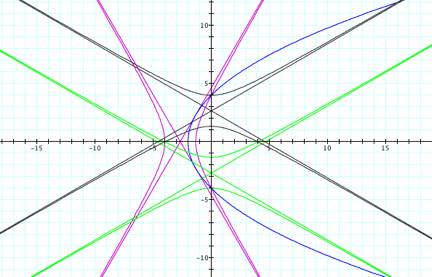
Now how does that compare to the graphs if ![]() and
and ![]() ?
?
These
graphs are similar to the first two, but they are not symmetrical over the y-axis like the first two were. They are still symmetrical over the x-axis.
Now how does that compare to the graphs if ![]() and
and ![]() ?
?
These
graphs are in exactly the same places as the ones on the third grid because I
zoomed in more they appear different.
The only difference between these graphs and the ones on the third grid
is the placement of the individual graphs. On the third grid, the first equation was where the second
one is now and vice versa. Also,
on the third grid, the third equation was where the fourth one is now and vice
versa. The graphs are still symmetrical.
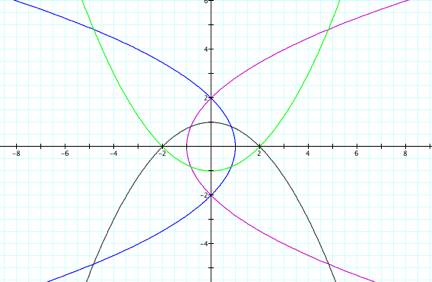
Now how does that compare to the graphs if ![]() and
and ![]() ?
?
The difference between these graphs and the ones on
the fourth grid is that these graphs mainly cover the second and third
quadrants and on the fourth grid, they mainly covered the first and fourth
quadrants. It appears like the
graphs on the fourth grid were rotated about the origin 180 degrees to become
the graphs on this grid.