
Guitar String Length
By Mary Negley
I started
this exploration by collecting my data.
I measured the length of a guitar string from a fret to the bridge of
the guitar. The length of the open
string was my initial measurement and the following frets, I numbered from 1 to
22. Below is the data that I
found.
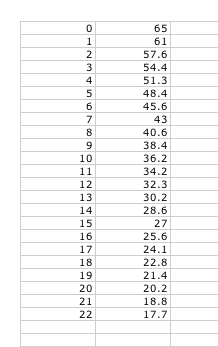
The
left column is the fret number and the right column is the distance from that fret
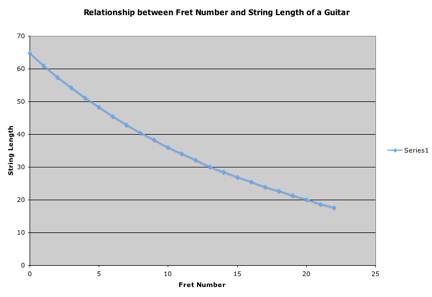
to the bridge of the guitar. I then graphed the data in a scatter plot, using
the left column as my x-values and
the right column as my y-values.
Below is the scatter plot.
Then
I found a function that modeled the data. First I found the ratio of each
string length to the previous one.
I found this:
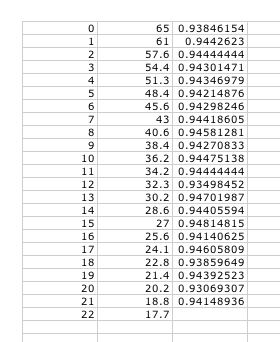
Next
I found the mean of the ratios, which was approximately ![]() . Then I computed
a third set of data by using the equation
. Then I computed
a third set of data by using the equation ![]() . Below is the new
spreadsheet and the new chart.
. Below is the new
spreadsheet and the new chart.
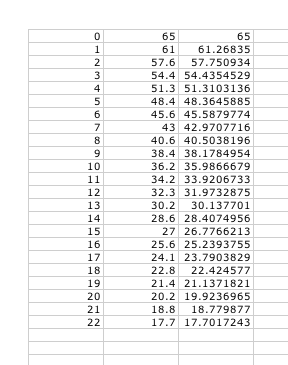
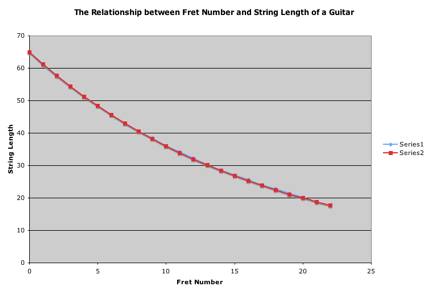
Looking at the graph (where Series1 is the collected data and
Series2 is the calculated data), my collected data seems to be pretty
accurate. A better test of the
accuracy would be the following:
Calculate a measure of the error between your model and the
collected data by taking the square of the difference for each time, sum the
squares, and divide by the number of data points.
Below is the spreadsheet, where I have calculated the measure of
error, using the above method.
|
0 |
65 |
65 |
0 |
0 |
|
1 |
61 |
61.26835 |
-0.26835 |
0.07201172 |
|
2 |
57.6 |
57.750934 |
-0.150934 |
0.02278108 |
|
3 |
54.4 |
54.4354529 |
-0.0354529 |
0.00125691 |
|
4 |
51.3 |
51.3103136 |
-0.0103136 |
0.00010637 |
|
5 |
48.4 |
48.3645885 |
0.03541155 |
0.00125398 |
|
6 |
45.6 |
45.5879774 |
0.01202257 |
0.00014454 |
|
7 |
43 |
42.9707716 |
0.02922836 |
0.0008543 |
|
8 |
40.6 |
40.5038196 |
0.09618036 |
0.00925066 |
|
9 |
38.4 |
38.1784954 |
0.22150464 |
0.04906431 |
|
10 |
36.2 |
35.9866679 |
0.21333206 |
0.04551057 |
|
11 |
34.2 |
33.9206733 |
0.27932667 |
0.07802339 |
|
12 |
32.3 |
31.9732875 |
0.32671252 |
0.10674107 |
|
13 |
30.2 |
30.137701 |
0.06229896 |
0.00388116 |
|
14 |
28.6 |
28.4074956 |
0.19250437 |
0.03705793 |
|
15 |
27 |
26.7766213 |
0.2233787 |
0.04989804 |
|
16 |
25.6 |
25.2393755 |
0.36062453 |
0.13005005 |
|
17 |
24.1 |
23.7903829 |
0.30961707 |
0.09586273 |
|
18 |
22.8 |
22.424577 |
0.37542296 |
0.1409424 |
|
19 |
21.4 |
21.1371821 |
0.26281792 |
0.06907326 |
|
20 |
20.2 |
19.9236965 |
0.27630355 |
0.07634365 |
|
21 |
18.8 |
18.779877 |
0.02012296 |
0.00040493 |
|
22 |
17.7 |
17.7017243 |
-0.0017243 |
2.9732E-06 |
|
|
|
|
|
0.04306591 |
The first column corresponds to the fret number, the
second column corresponds to the measured length, the third column corresponds
to the calculated length using the formula, the fourth column is the difference
between the entries in the second and third columns and the fifth column is the
squares of the entries in the fourth column. The last entry in the fifth column, 0.04306591, is the
average of the other entries in the fifth column. It is the measure of error. So my measured values are only 4.31% off.