
Exploring ![]()
By Mary
Negley
In
this exploration, I will look at graphs of the quadratic ![]() for various
values of b and discover a
relationship among the vertices.
Below are the graphs of
for various
values of b and discover a
relationship among the vertices.
Below are the graphs of ![]() , where b is equal to integers ranging from -3 to 3, on one grid.
, where b is equal to integers ranging from -3 to 3, on one grid.
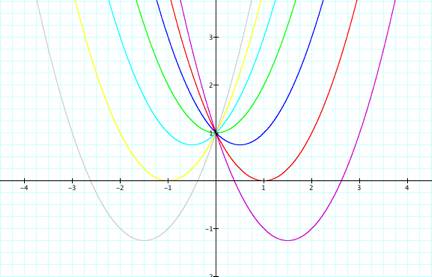
When ![]() , the graph is fuschia. When
, the graph is fuschia. When ![]() , the graph is red. When
, the graph is red. When ![]() , the graph is blue. When
, the graph is blue. When ![]() , the graph is green. When
, the graph is green. When ![]() , the graph is light blue. When
, the graph is light blue. When ![]() , the graph is yellow. When
, the graph is yellow. When ![]() , the graph is gray.
, the graph is gray.
Notice that when ![]() and
and ![]() , the graphs cross the x-axis at exactly two places, when
, the graphs cross the x-axis at exactly two places, when ![]() and
and ![]() , the graphs touch the x-axis at precisely one place, and for the other values of x, the graphs do not touch the x-axis.
, the graphs touch the x-axis at precisely one place, and for the other values of x, the graphs do not touch the x-axis.
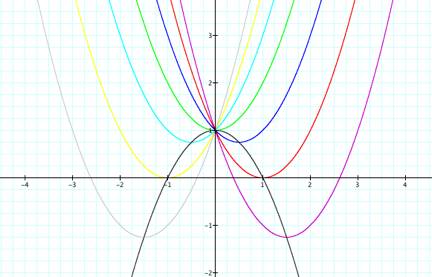
A conjecture is that the vertices of the above
quadratics all lie along the quadratic ![]() . Below is a
picture of the quadratic
. Below is a
picture of the quadratic ![]() with the
previous quadratics and it appears that the conjecture is correct. To be more certain, I will calculate
the vertices of the quadratics and determine whether they lie along the
quadratic
with the
previous quadratics and it appears that the conjecture is correct. To be more certain, I will calculate
the vertices of the quadratics and determine whether they lie along the
quadratic ![]() .
.
To find the vertex of a parabola, I can calculate the
derivative of the quadratic, set that derivative equal to zero, solve for x and then plug that x-value into the original equation to find the
corresponding y-value. I will then have the vertex.
First
I will find the vertex of ![]() .
.
1.
Find the derivative.
![]()
2.
Set it equal to zero and solve for x.
![]()
![]()
![]()
3.
Plug that value into the original equation and solve for y.
![]()
![]()
![]()
So
the value of the vertex is ![]() .
.
Likewise, using the method above you can get that the
vertices are:
|
b-value |
Vertex |
|
-3 |
|
|
-2 |
|
|
-1 |
|
|
0 |
|
|
1 |
|
|
2 |
|
|
3 |
|
Notice that the difference between the y-value of the first vertex in the chart and the y-value of the second vertex is ![]() . The difference
between the second and the third is
. The difference
between the second and the third is ![]() . The difference
between the third and the fourth is
. The difference
between the third and the fourth is ![]() and the
difference between the fourth and the fifth is
and the
difference between the fourth and the fifth is ![]() . The difference
between the fifth and the sixth is
. The difference
between the fifth and the sixth is ![]() . Finally, the
difference between the fifth and the sixth is
. Finally, the
difference between the fifth and the sixth is ![]() . Since the differences
are not constant, I know that the relationship among the vertices is not
linear. Taking the differences one
more time, I find that the difference is a constant
. Since the differences
are not constant, I know that the relationship among the vertices is not
linear. Taking the differences one
more time, I find that the difference is a constant ![]() , so the relationship is quadratic. I already know the value of the y-intercept because one of the vertices is
, so the relationship is quadratic. I already know the value of the y-intercept because one of the vertices is ![]() , which must be the y-intercept. To find the
rate of change of the quadratic, I take the points
, which must be the y-intercept. To find the
rate of change of the quadratic, I take the points ![]() and
and ![]() and I find that
the slope is -1. So the quadratic
must be
and I find that
the slope is -1. So the quadratic
must be ![]() and thus, our
conjecture is correct.
and thus, our
conjecture is correct.