
Assignment 12: Exploring Mathematics in Spreadsheets
by Shawn Broderick
For this assignment about exploring mathematics using spreadsheets, I chose to investigate problem 8 from the Assignment 12 web page.
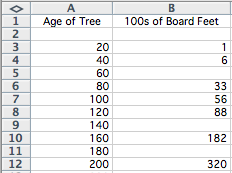
Question 8 is about finding some information about how many feet of boards you can get from a tree based on their age. The older the tree the bigger it is and thus, the more board feet you can get out of it. Here is the table given in the problem description:
| Age of Tree | Hundreds of Board Feet |
20 |
1 |
40 |
6 |
60 |
|
80 |
33 |
100 |
56 |
120 |
88 |
140 |
|
160 |
182 |
180 |
|
200 |
320 |
What I will do is use a spreadsheet and (1) fill in the missing numbers using a trendline, (2) extend the table to see how many board feet can come from a 300-year-old tree by extending the trendline, and (3) investigate different types of trendlines to see which is the best.
(1) and (2) Using Excel, I inserted the data into the cells like this:
With Excel, you can make a chart from this data. All you have to do is select the two columns, click the chart button and that's about it! Here is the chart that I made initially:
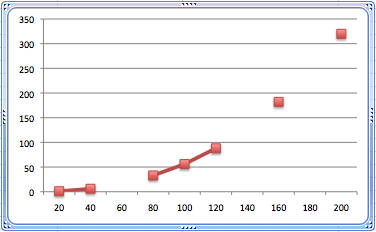
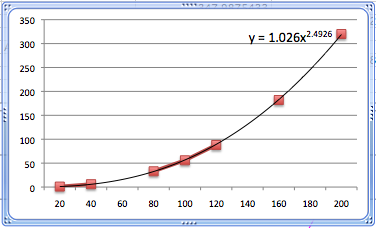
As you can see, there are only a few data points to work with. When I saw this pattern and previewed the possible types of trendlines, I thought that an power trendline would be the best fit. Here is the added trendline and equation:
I used the equation to set up another table of numbers to interpolate the numbers I needed in between the ones that were there and extrapolate the ones I needed for up to 300 years old. Here is the new table:
| Age of Tree | Hundreds of Board Feet |
| (Power Trendline Data) | |
20 |
1.0 |
40 |
5.8 |
60 |
15.9 |
80 |
32.5 |
100 |
56.7 |
120 |
89.3 |
140 |
131.1 |
160 |
182.9 |
180 |
245.3 |
200 |
319.0 |
220 |
404.5 |
240 |
502.5 |
260 |
613.4 |
280 |
737.9 |
300 |
876.3 |
Now we have filled in the table and extended it!
(3) Finally, I wanted to compare the errors of the various trendlines. So, to the chart that I had made, I added the rest of the trendlines and pulled their equations:
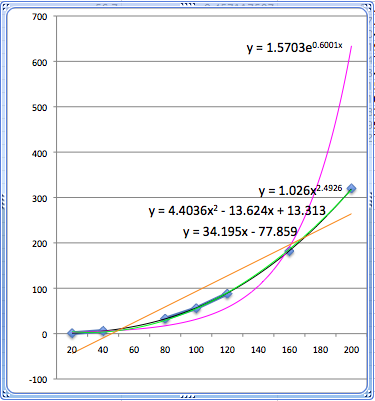
Blue = original data
Black = Power Trendline
Pink = Exponential Trendline
Orange = Linear Trendline
Green = Polynomial Trendline
To check the error of the trendline we take each data point of the original data square the difference from the trendline point and average that set of values. Here is what I found for the errors:
| Power Trendline Error | 0.6 |
| Polynomial Trendline Error | 8.4 |
| Linear Trendline Error | 1306.1 |
| Exponential Trendline Error | 14362.9 |
Here we can see that the closest trendline is the power trendline as we visually assessed in the beginnning. Spreadsheets are a great tool. This is just one application of many.
Here is the Excel file if you were curious to explore it further: