
ASSIGNMENT 9
PARAMETRIC CURVES
BY:
DEBORAH ECKSTEIN
ASSIGNMENT 9
PARAMETRIC CURVES
BY:
DEBORAH ECKSTEIN
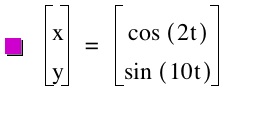
A parametric curve in the plane is a pair of functions , x=f(t) and y=g(t), where the two continuous functions define ordered pairs (x,y).
For assignment 9 we will explore:
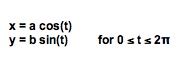
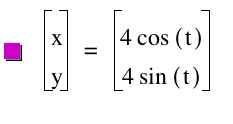
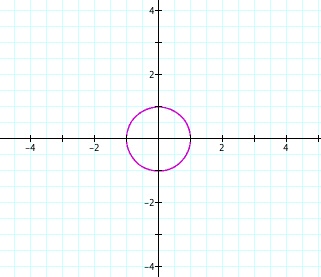
Let us first let a and b have the same value.
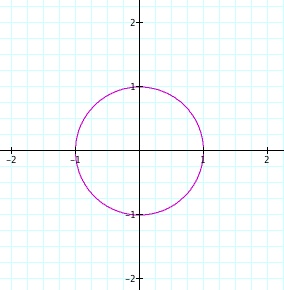
Notice that we get a circle. Do you think this will always be the case? Or can the circle get any bigger or smaller depending on what our value of a or b is. Let's check out a few more graphs where we have the same value for a and b.
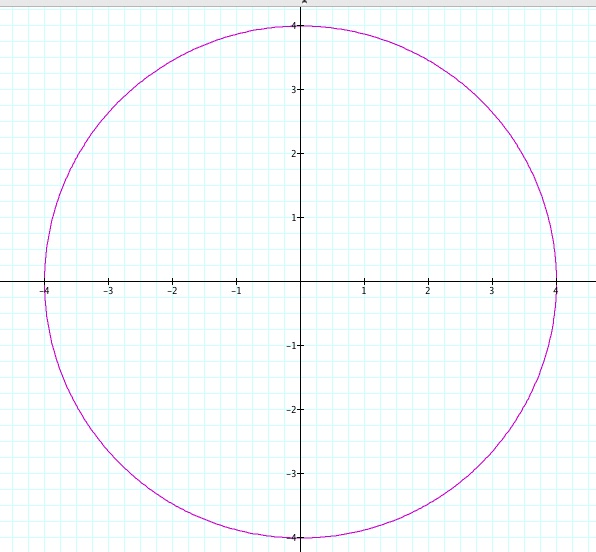
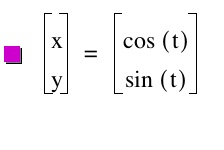
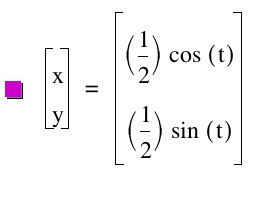
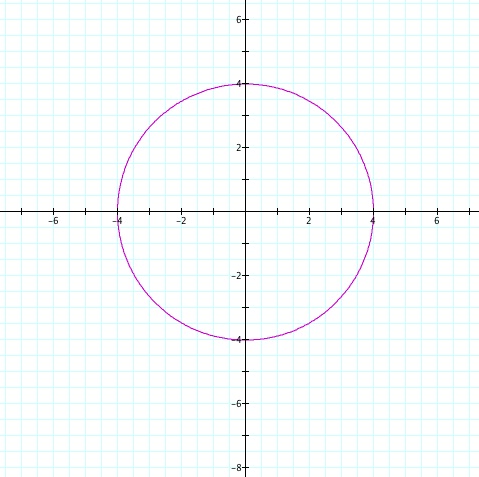
Notice that we still have a circle, it is just a lot bigger and it goes to the coordinates 4 and -4 on our x and y axis.
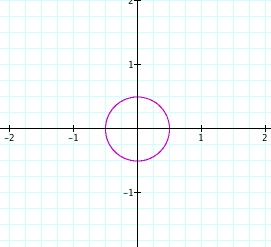
And here we still have a circle, it is just smaller and our x and y coordinates are .5 and -.5. We can conclude that as long as we have the same value for our a and b we will get a circle. A and B also determine the size of the circle that we get! What would happen if our two values were the same BUT negative.
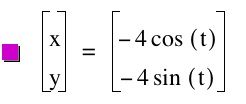
Nothing changes, we still get a circle with the coordinates 4 and -4.
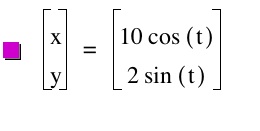
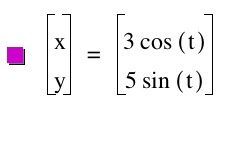
Now let us see what can happen when we vary a and b. Let's let a > b.
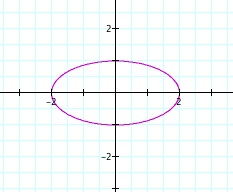
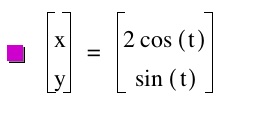
We no longer have a circle. Our graph has turned into an ellipse with x coordinates at 2 and -2 and y coordinates at 1 and -1. Why do you think this is so? Let's make a few more values for a and b and see what happens to our ellipse.
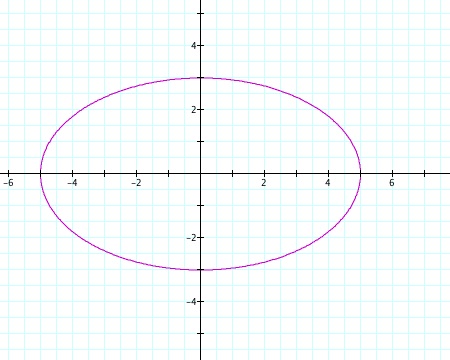
We get an ellipse every time that our a value is greater than b. You can see how the a and b relate in this equation. When the variance between the two is greater then the ellipse is skinnier!
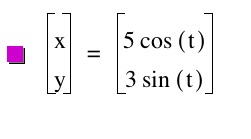
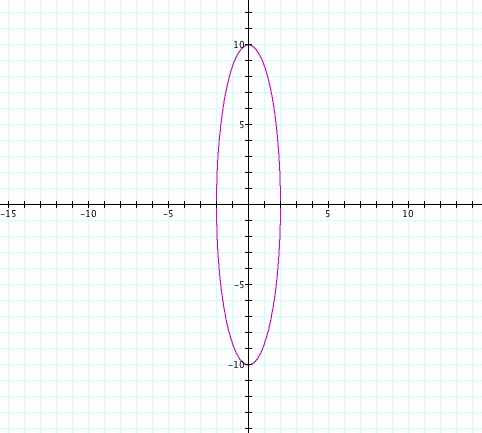
Now lets see what happens when we let b be greater then a.
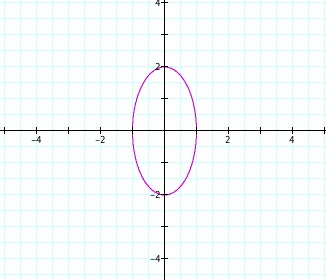
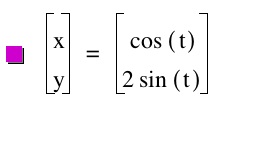
I used the same coordinates as my first a > b and look... we still get an ellipse that looks exactly the same except it is around a different axis...COOL! Do you think that will happen for the rest? We shall see..
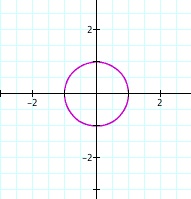
YEP! We get the same ellipse just about a different axis. What we can gather from what we have done with playing with the values of a and b is that you will always get a circle or an ellipse. There are many other ways that you can change around the original equations. Let's try putting a and b into the parenthesis instead of having them in front of sin and cos.
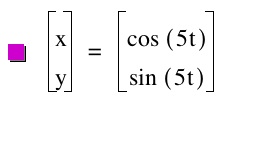
Look! When we have the same values we still get a circle. Interesting...
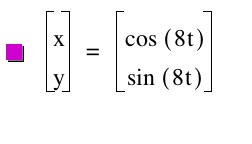
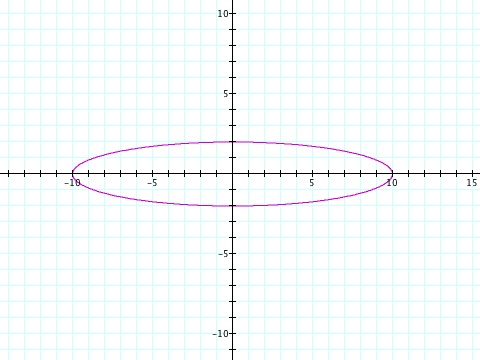
But notice that our circle never gets bigger like it did before. Why do you think this is so? Now let us look at when we vary a and b and make one greater than the other. For this I choose to work with the previous numbers 10 and 2.
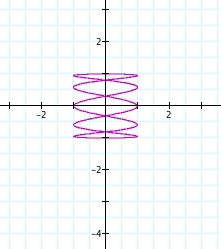
Notice that the same graphs come about again but on a different axis. We are also no longer dealing with an ellipse. This is very interesting and you can start picking up on patterns the more you do of these. Now that we have explored one a and b value placement thoroughly and one roughly, let's combine the two and see what kind of graphs we come up with.
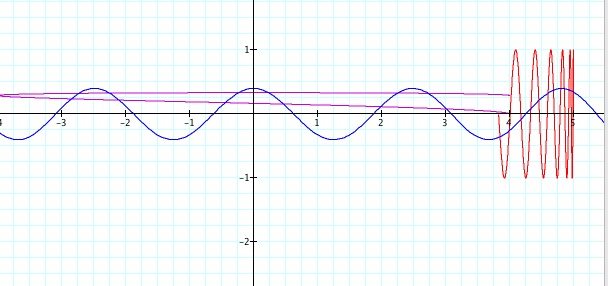
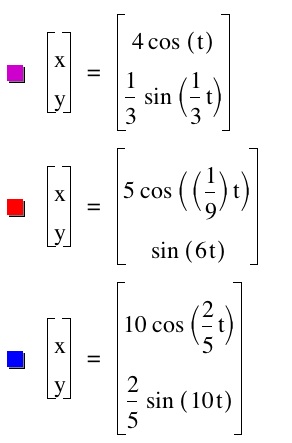
There are an infinite amount of graphs that can be created! Just keep playing with the numbers and you will get many many combinations!