

Explored By:
Aubrey D. Johnson
We will examine the effects on the sine graph as we change the a, b, c values in the equation y = a sin (bX + c). We will explore the effects that these alterations have on the frequency and periods of the graph as well the amplitude of the graph.
Now in our equation which variable controls frequency? Period? Amplitude?
First we must recognize and understand what a basic sine graph looks like. y = sin(X).
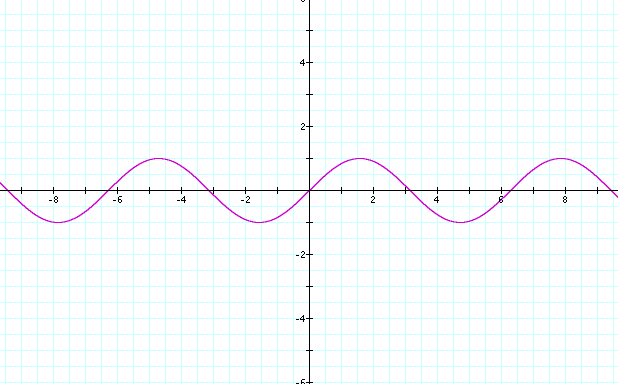

Now, what will look to see how placing values in all the variable spaces alter the topography of the graph. We will change the variables to all ones, twos and then threes.
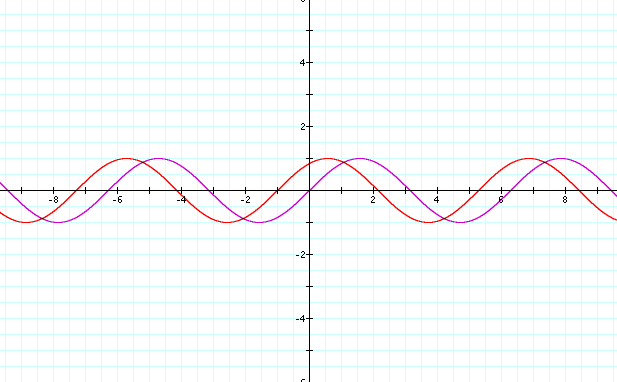

**Notice here that the graph only appears to have been sifted one back on the x-axis**
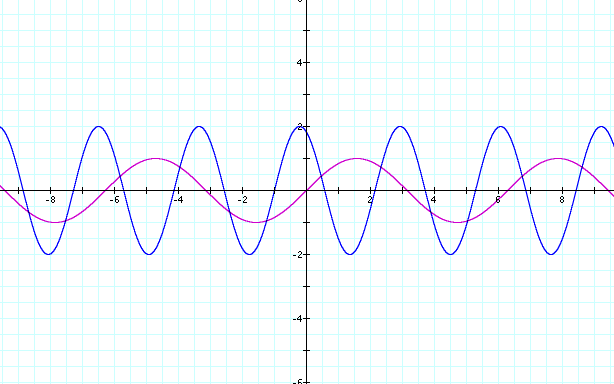

**Notice here that the graph appears to have gotten bigger and a possible shift to the left on the x-axis has seemed to occur**
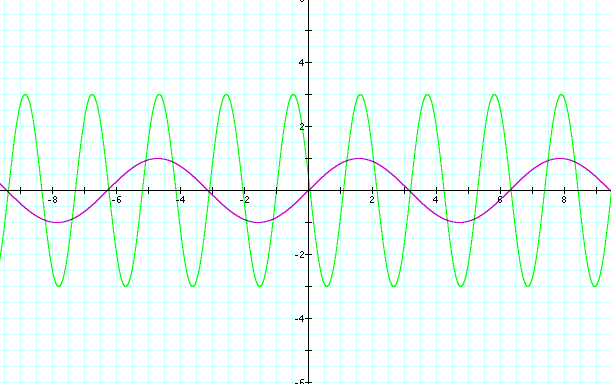
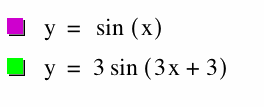
**This graph also seems to have gotten bigger, but there also seems to be more "waves" along the x-axis. A shift has occurred, though it almost seems that the graphs are the opposite of one another**
As we can see the graphs have changed height and how often the curve occurs. The height of the graph, looks like mountain peeks and then these peeks slip down into valleys. This is known as the amplitude. We also have discovered that the higher the number the greater the amount of times that the graph is repeated. This repetition is known as the frequency. Now that we have demonstrated how the graph can be effected when different size variables are used, we now should inspect which variable cause which phenomena.
Let us first start with y = 2 sin (X) and use this as our base graph (it will be in red) as we alter variables b and c. We will alter the c value to determine the effects the c variable has on the graph. (The gray graph is there as a reminder to what the sine graph actually looks like.)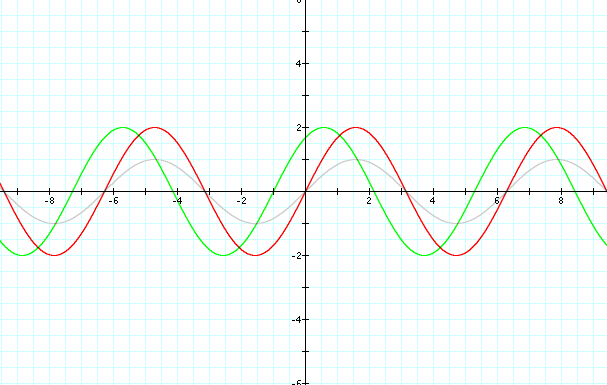
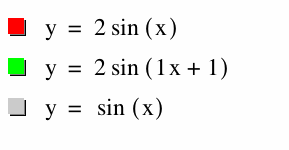
The red graph is the 2 times the sine graph. Notice how the red graph is double the size of the original graph. The 2 is in the place of variable "a." Let us assume for this picture that a does control the height, or the amplitude of the graph. As we shift our attention to the green graph we notice that the graph has been shifted to the left. This is a negative shift one unit on the x-axis, but our equation has a positive one. Do we want to assume that the variable "c" controls the x intercept(s) of the graph? Even if the graph is saying the opposite of the equation? Looks like this hypothesis needs more exploration. Maybe we should try putting a three in for c instead of the one.
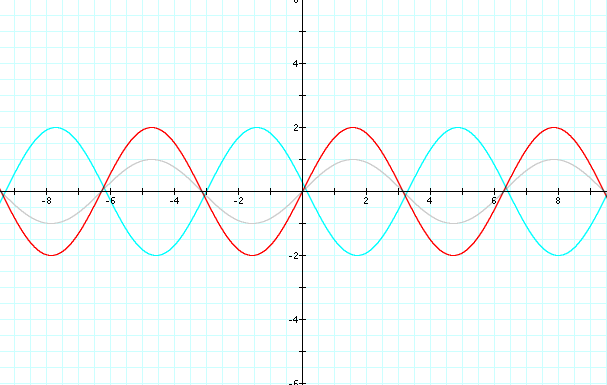
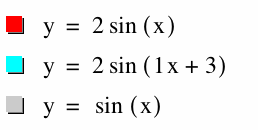
The light blue line represents the new graph. The light blue graph almost appears to be a mirror image of the red graph. There has been a shift in the placement of the graph. But once again this shift seems to be in the negative even though I placed a positive number in for c. The original graph (gray) appears to intersect at the origin, as does the light blue graph, however they are at different points in the cycle. I want to know at which point on the x-axis this graph looks like the original gray graph. So because I entered a positive three into the function I count 3 places to the right on the x-axis, but I notice that it just does not line up right. So I count three to the left on the x-axis and there it is! This seems odd to me, to enter a positive and get a negative. So I look back at the previous graph and see very plainly that the green graph has been shifted to the left one place on the x-axis. Now I would like to know if the opposite is true. If I enter a negative three, will my graph shift to the right on the x-axis?
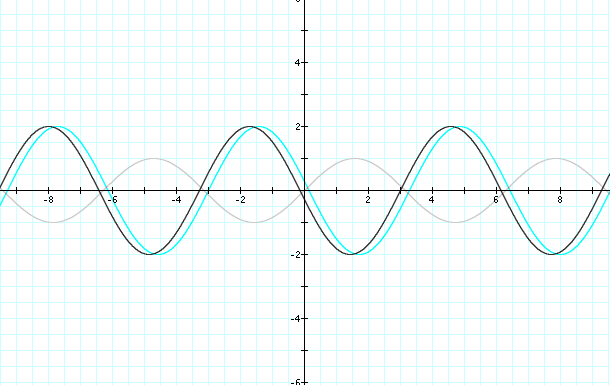
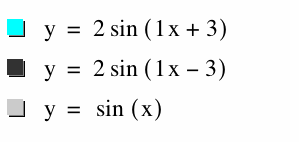
I have taken out the red graph to make the comparison more visible, the gray graph remains for reference purposes. The black graph has the -3 in the equation. Notice that the light blue graph and the black graph do not line up perfectly. However the black graph does intersect at the positive three on the x-axis. It appears that the "c" variable controls the shift of the graph. So the graph will shift opposite of the sign on "c."
It has been shown the effects of a and c on the sine graph, but what does the variable b control?
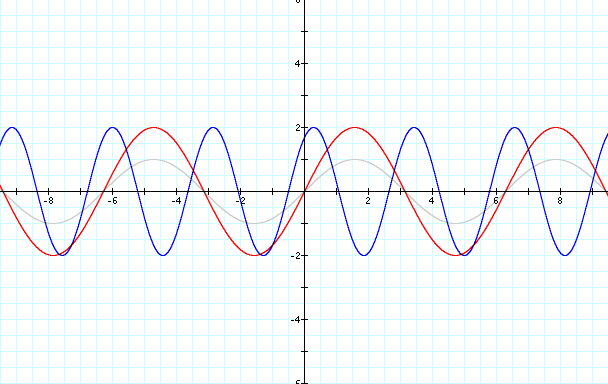
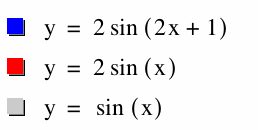
Frequency is a measure of the number of occurrences of a repeating event per unit time. It is also referred to as temporal frequency. The period is the duration of one cycle in a repeating event, so the period is the reciprocal of the frequency. Looking at the blue graph we see that that the graph repeats itself 2 times with in the normal cycle of the the gray and red graphs. So b, controls the frequency.
We have successfully explored the sine graph and all of its variables. Now we can create any kind of graph or graphs and be able to visualize a graph just by looking at the equation.