![]()
Parametric Curves
by
Hee Jung Kim
For various a, b, c, and d, let's observe the
graph of the parametric equations x = acos(bt) and y = csin(dt) when as the
parameter t varies from 1 to ![]() .
.
I. Let's find some effects of b and d on the graph of x = a cos(bt), y = c sin(dt). Let's fix a = 1 and c = 1: x = cos(bt), and y = sin(dt)
1.1. If b = d, the graph is a unit circle for any nonzero values b and d.
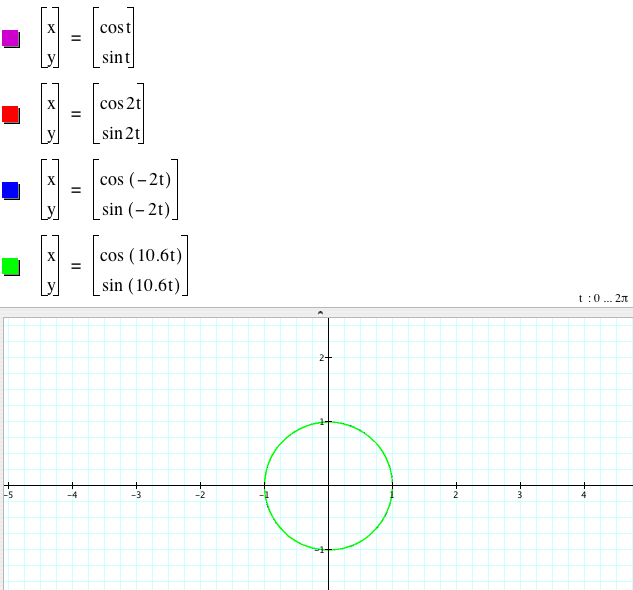
1.2. If b ![]() d, but |b| = |d| , we can still have a unit circle.
d, but |b| = |d| , we can still have a unit circle.
1.3. If |b| ![]() |d|,
|d|,
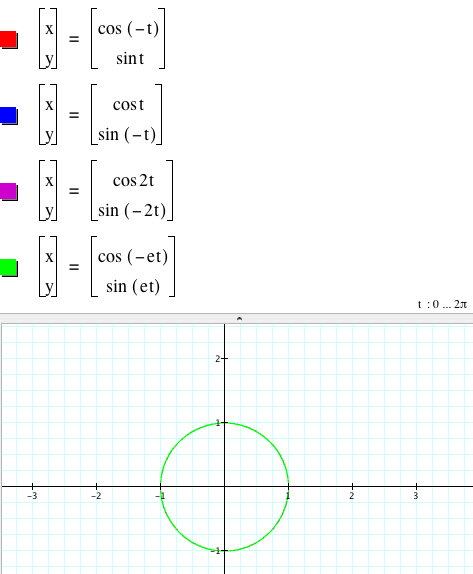
Since the cosine function is an even function (cos(-x) = cos x), the graphs of x = cos bx, y = sin dx, and x = cos(-bx), y = sin dx coincide. Even though the sine function (sin(-x) = sin x) is an odd function, the sign change does not change the graph.
Therefore all four graphs of
x = cos(|b|t), y = sin(|d|t),
x = cos(-|b|t), y = sin(|d|t),
x = cos(|b|t), y = sin(-|d|t),
x = cos(-|b|t), y = sin(-|d|t)
coincide.
Now we will only consider b > 0 and d > 0, and observe graphs.
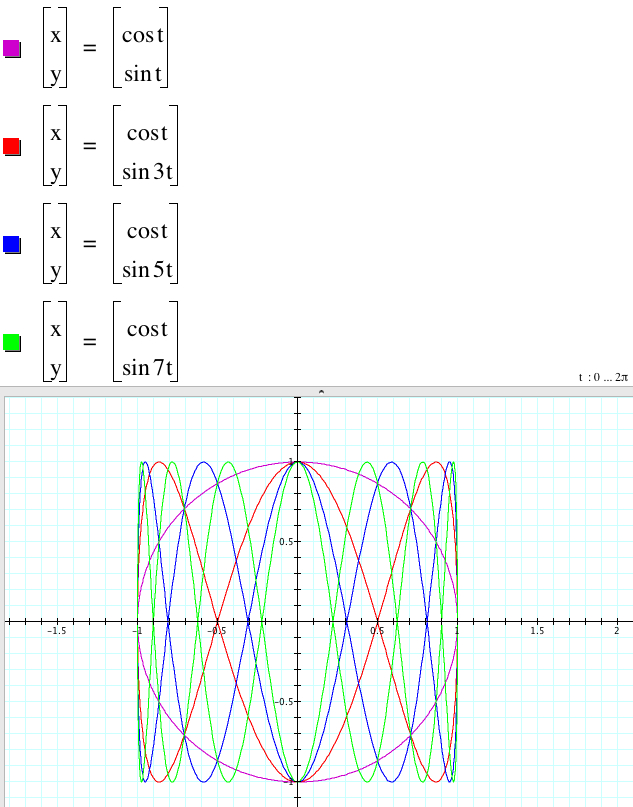
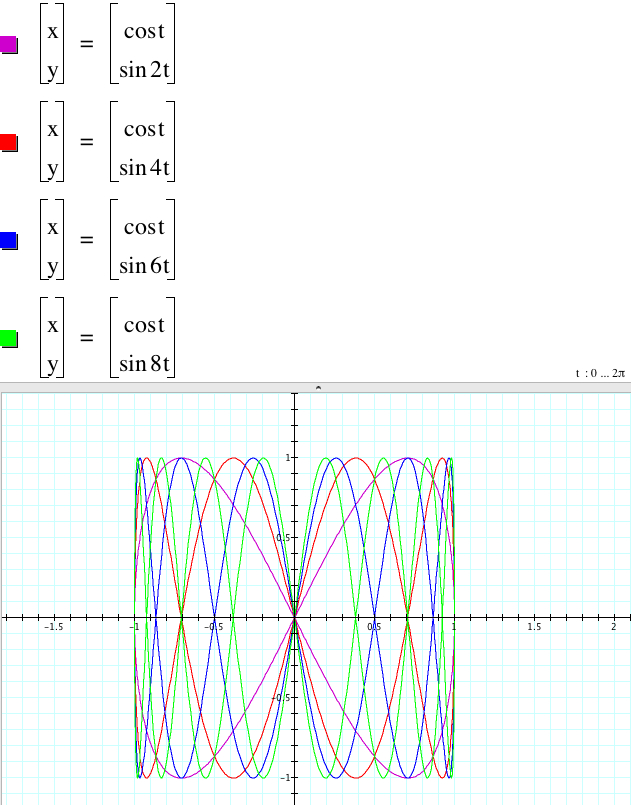
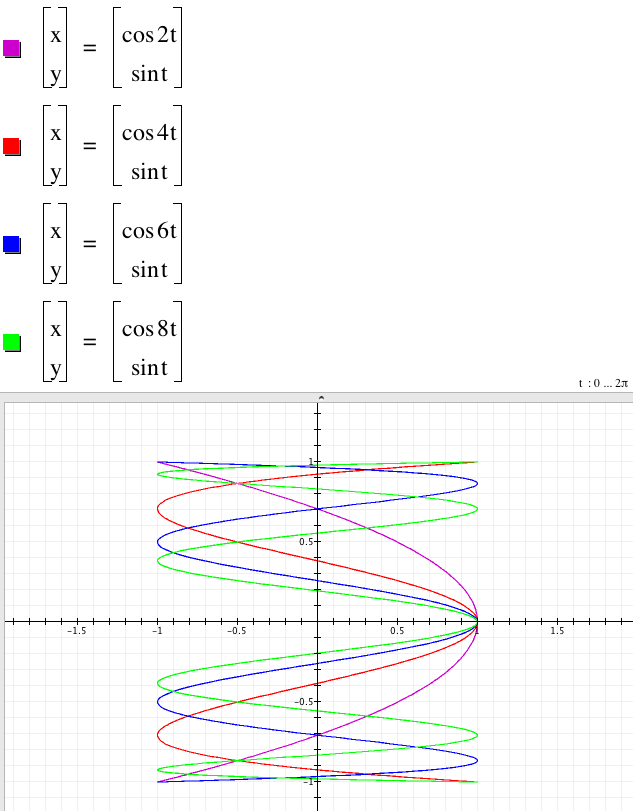
1.4. Let's fix b =1 and make d increase.
When d is odd or even as a whole number, we find that the number of the crosss-section occurred inside the boundary is d-1. In this sense there is no the crosss-section for x = cos t and y = sin t. Even if d is getting larger, the amplitude is the same, which is 1. But the frequency is getting larger. When d is odd, the graphs do not meet with the origin, but when d is even, all graphs pass through the origin. We also find that the graphs look closed.
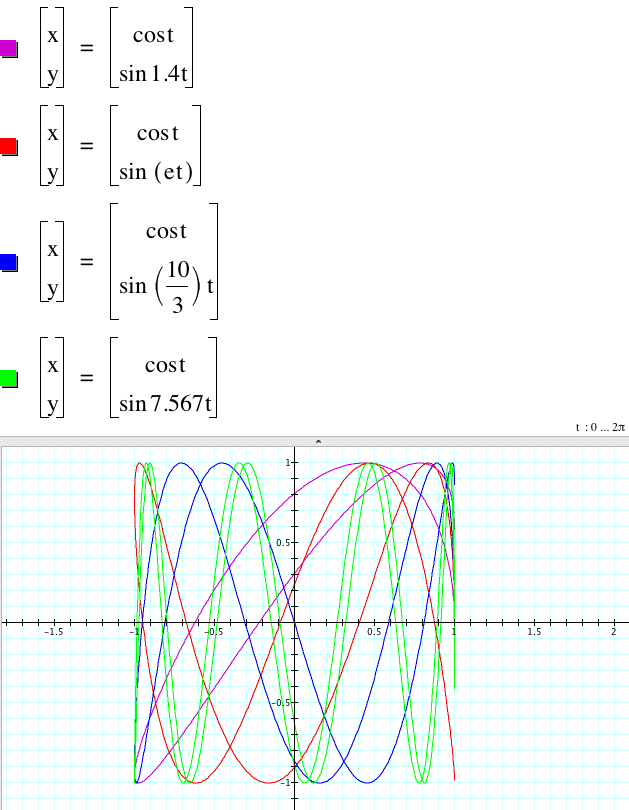
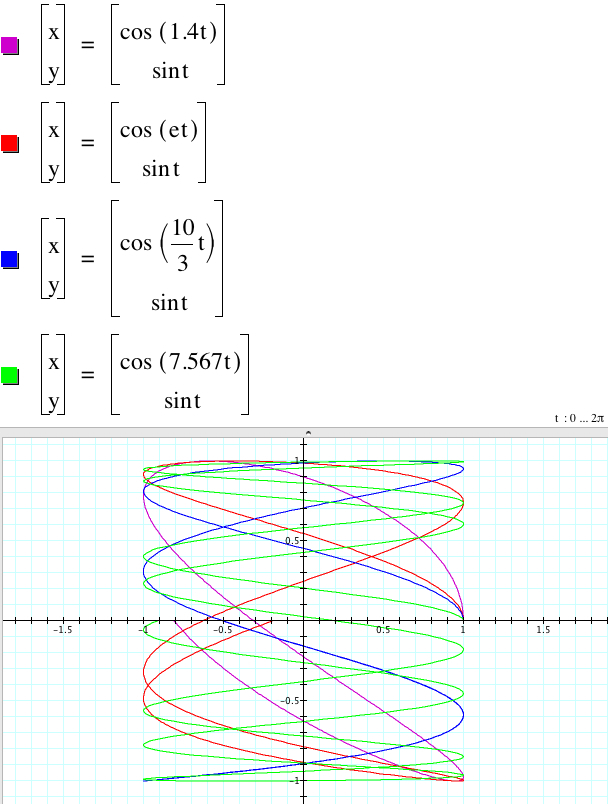
How about any real number d? Like the whole number case, as d increases, the frequency increases irregularily. And the graphs look open.
1.5. Let's fix d = 1 and make b increase.
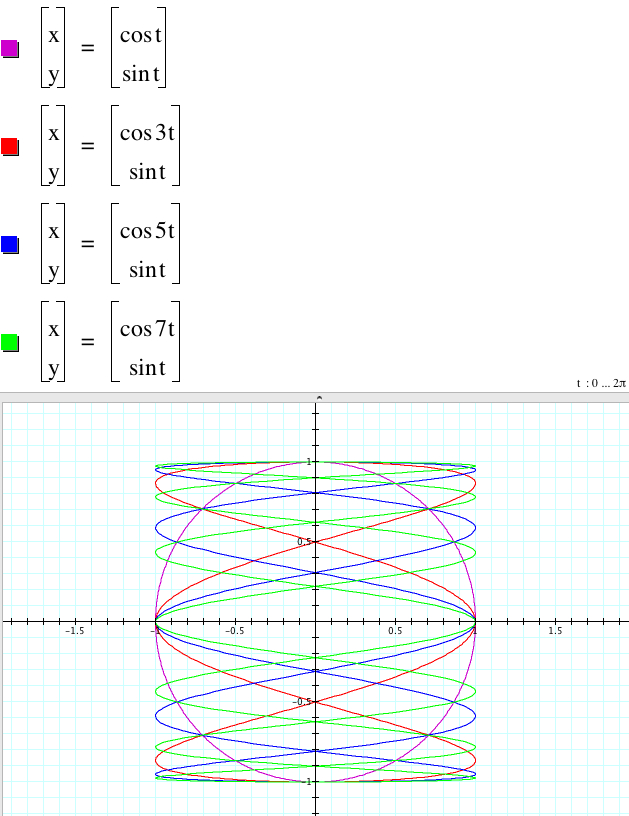
Whether b is odd or even, the frequencies increase as b increases, and amplitude is still 1. However, when b is odd, the graphs are similar to the rotated graphs of 'odd d case' above by the 90 degree. But when b is even, the graphs do not inner-intersect. When b is a real number, the graphs look open.
III. Let's find some effects of a and c on the graph of x = a cos(bt), y = c sin(dt).
3.1. Let' assume that |b| = |d|.
3.1.1. Let's fix b = d = 1.
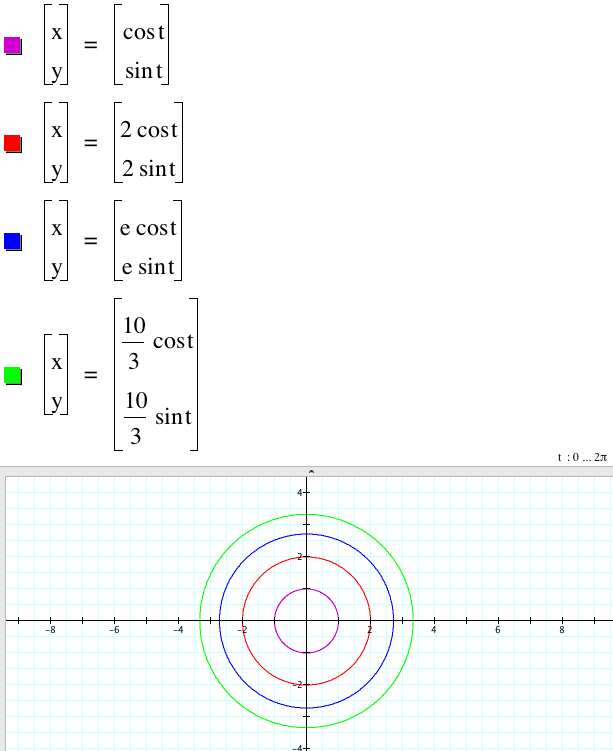
As |a| = |c| increases the radius (|a| = |c|) increases because
![]()
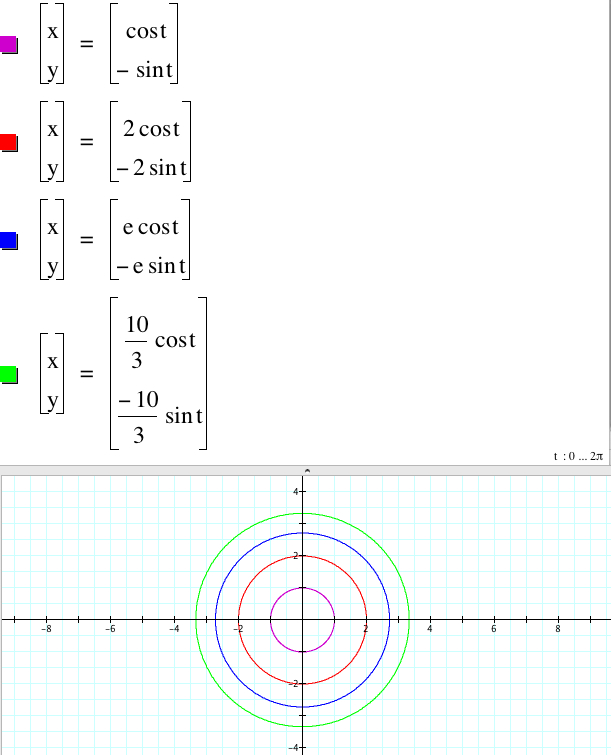
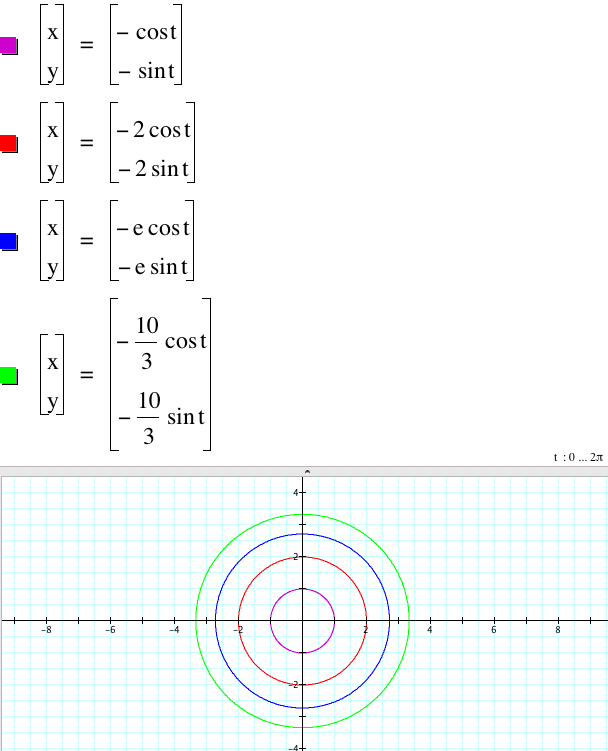
Therefore all four graphs of
x = |a|cos(t), y = |c|sin(t),
x = -|a|cos(t), y = |c|sin(t),
x = |a|cos(t), y = -|c|sin(t),
x = -|a|cos(t), y = -|c|sin(t)
coincide.
3.1.2. Let's fix b = d = 2 and observe the graphs.
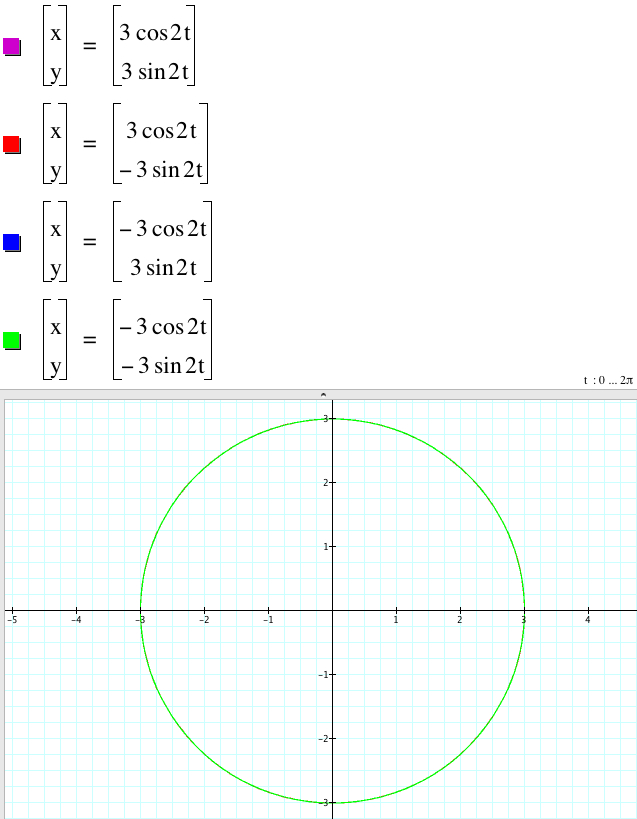
Therefore all four graphs of
x = |a|cos(2t), y = |b|sin(2t),
x = -|a|cos(2t), y = |b|sin(2t),
x = |a|cos(2t), y = -|b|sin(2t),
x = -|a|cos(2t), y = -|b|sin(2t)
coincide.
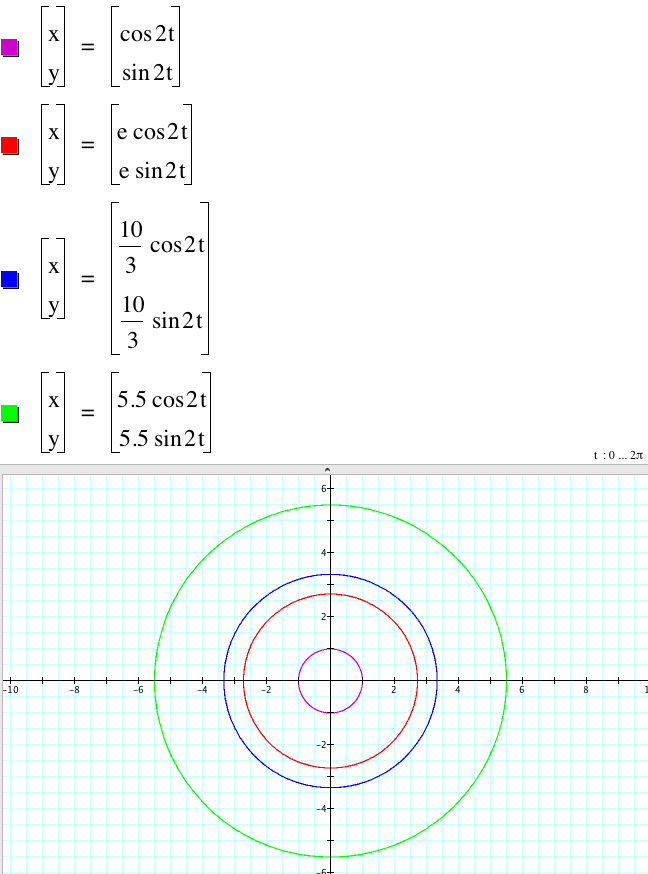
The value of |a| = |c| is the measure of the radius of the circle, so as |a| = |c| increases the circle is getting bigger.
In general, when |b| = |d| and |a| = |c|, all graphs of
x = |a|cos(bt), y = |c|sin(dt),
x = -|a|cos(bt), y = |c|sin(dt),
x = |a|cos(bt), y = -|c|sin(dt),
x = -|a|cos(bt), y = -|c|sin(dt)
coincide, and |a| = |c| is related to the radius of the circle, so the larger |a| = |c| is, the larger the circle is.
![]()
3.2. Now
we consider b and d such that |b| ![]() |d|.
|d|.
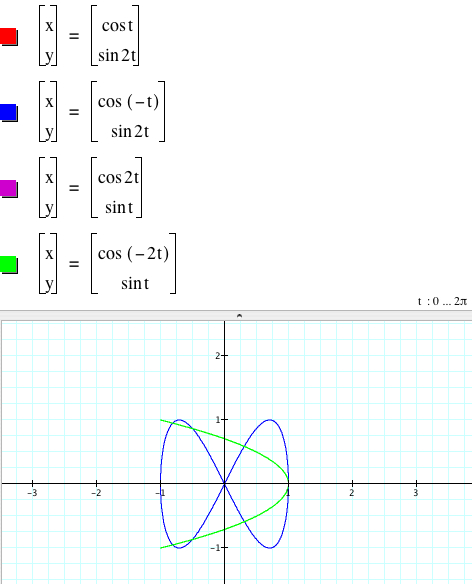
3.2.1. When b < d, let's set b = 1, d = 2 for simplicity.
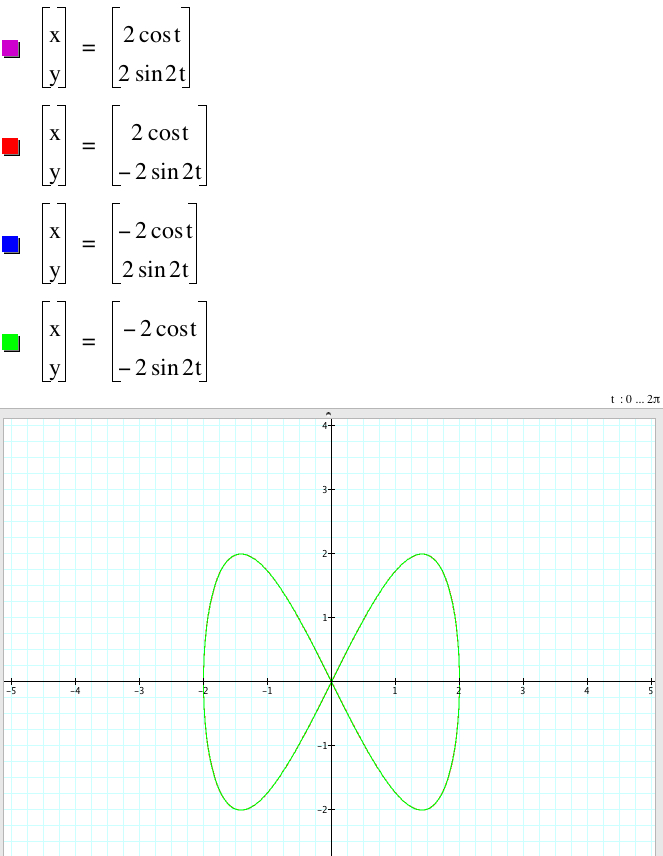
When |a| = |c|, all four graphs of
x = |a|cos(t), y = |c|sin(2t),
x = -|a|cos(t), y = |c|sin(2t),
x = |a|cos(t), y = -|c|sin(2t),
x = -|a|cos(t), y = -|c|sin(2t)
coincide.
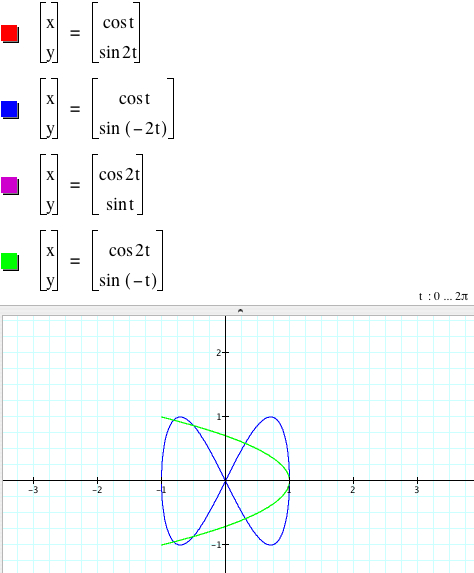
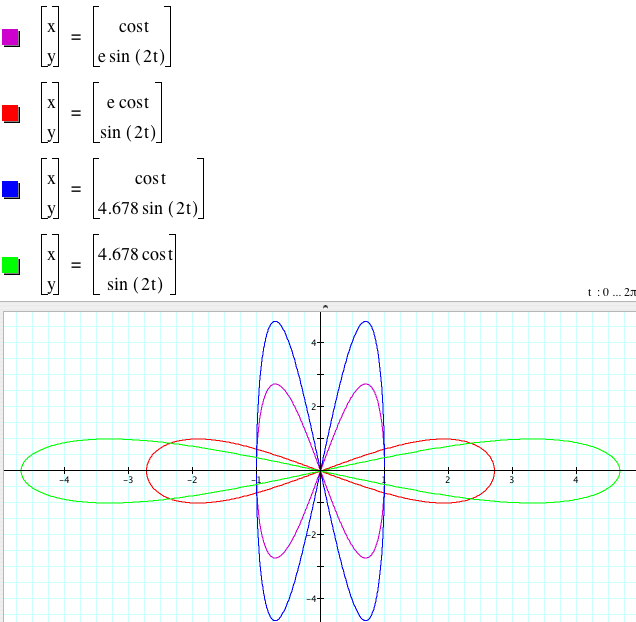
Let's variate c for a fixed a. Let me use a = 1.
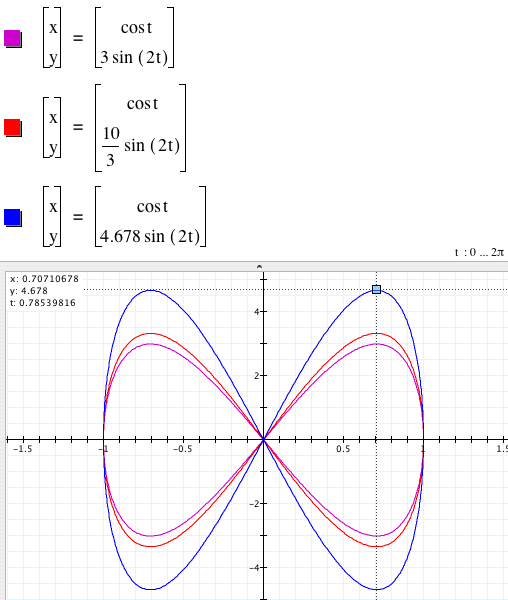
As |c| gets larger, the bow-tie gets larger. In fact, the value of c is the maximum value and -c is the minimum value of the graph. The x-values vary between -1 and 1 because the cosine function varies -1 and 1.
Now, I will variate a for a fixed a. Let me use c = 1.
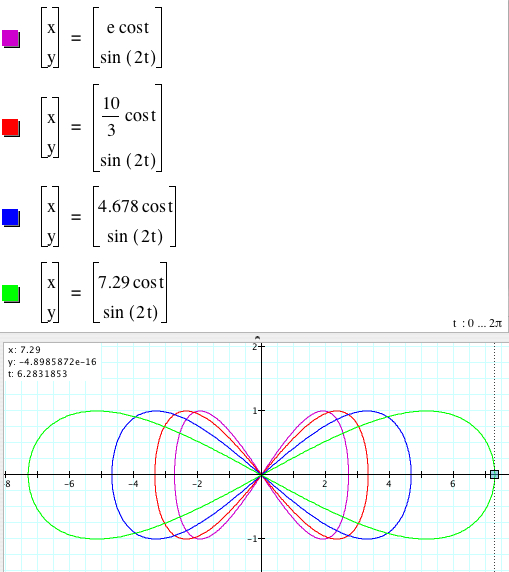
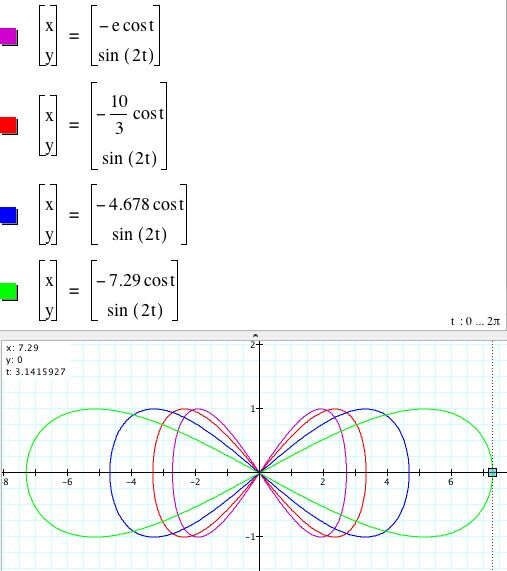
We find that the graph
x = |a|cos t, y = sin 2t
and
x = -|a|cos t, y = sin 2t
coincide. Intersetingly, |a| is the absolute value of the x-intercepts of the graph, so as |a| is getting larger, the bow-tie is getting elonged. The range of the y-values is between -1 and 1.
3.2.2. When b > d, let's set b = 2, d = 1 for simplicity.
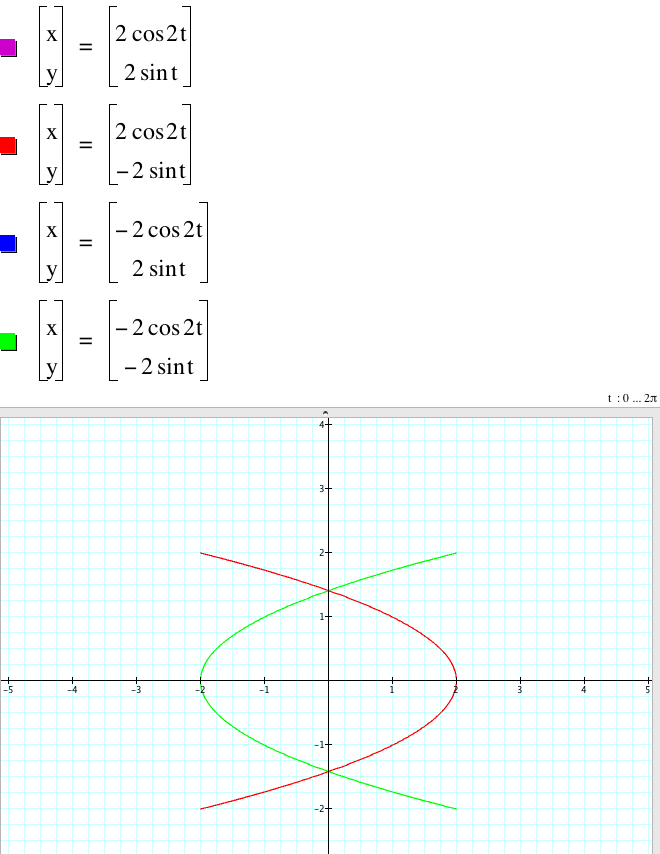
From the graphs above, when |a| = |c|, the graphs of
x = |a|cos(2t), y = |c|sin(t) and x = |a|cos(2t), y = -|c| sin(t)
coincide, and the graphs of
x = - |a|cos(2t), y = |c|sin(t) and x = - |a|cos(2t), y = -|c| sin(t)
coincide. They are symmetric with respect to the y-axis. (|a|, 0) is the vertex of the graph of x = |a| cos(2t), y = |c| sin(t) or x = |a| cos(2t), y = - |c| sin(t), and (-|a|, 0) is the vertex of the the graph of x = - |a| cos(2t), y = |c| sin(t) or x = - |a| cos(2t), y = - |c| sin(t).
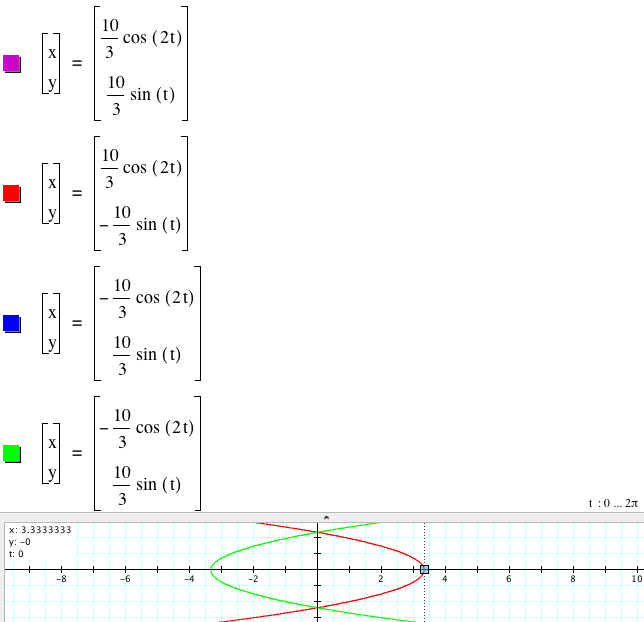
Let's variate a for a fixed c. Let me use c = 1.When a varies between -10 and 10, we have the following animation.
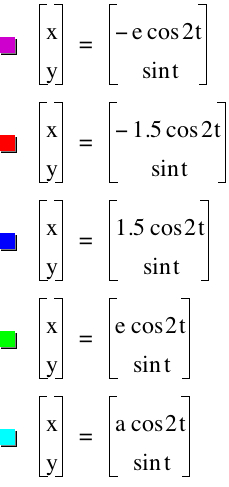
From the graphs above, we see that the graphs of
x = |a|cos(2t), y = sin(t) and x = -|a|cos(2t), y = - sin(t)
are symmetric with respect to the y-axis.
Finally, let's variate c for a fixed a. Let me use a = 1.
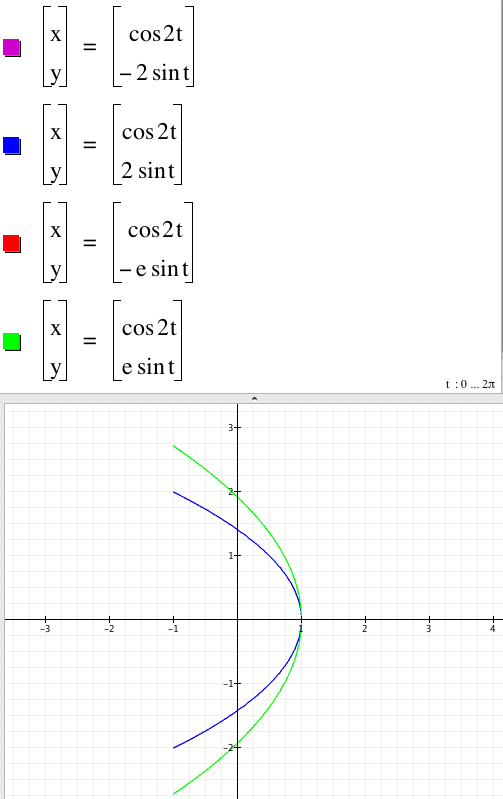
The graphs of
x = cos(2t), y = |c|sin(t) and x = cos(2t), y = -|c| sin(t)
coincide. When we set the range of c between -30 and 30, we see that the larger |c| is, the wider the parabola is.