![]()
Polar Equations
by
Hee Jung Kim
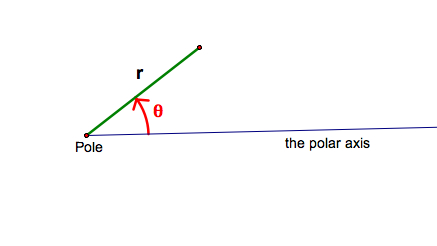
There are two coordinate systems in the plane: the Cartesian coordinate system and the polar coordinate system. Any point in the plane can have the Cartesian coordinates (x, y) or the polar coordinates (r, θ) in the corresponding system. The polar coordinates (r, θ) of a point consists of the radial coordinate r and the angular coordinate θ. The r coordinate represents the directional distance from the origin called the pole, and the θ coordinate represents the counterclockwise angle from the the initial ray called the polar axis. The polar axis usually coincide with the x-axis in the Cartesian coordinate system.
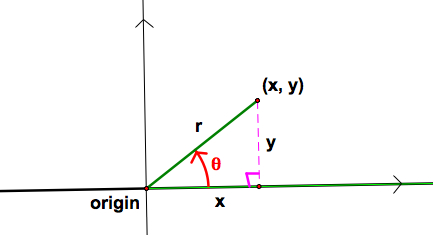
When we overlap two coordinate systems, we can easily convert the polar coordinates (r, θ) of a point to the Cartesian coordinates (x, y).
x = r cos θ
y = r sin θ
![]()
I. Now, let's investigate the
behavior of the graph of the polar equation r = 2asin (kθ)
+ b varying the values of (nonzero) a, b,
and k with![]() .
.
1.1. The effect of a
Let's set b = 0 and k = 1, and observe the graph of r = 2asinθ as a varies. In the animation below, a varies from 0 to 10.
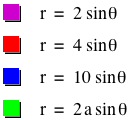
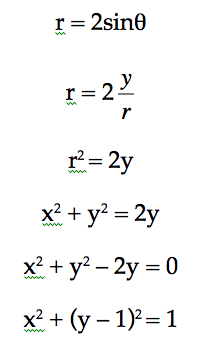
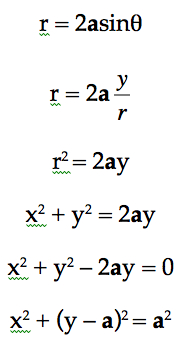
The graph of r = 2asinθ is a circle with center (0, 1) and radius 1. It can be also algebraically shown by converting the polar equation into the equation in the Cartesian coordinate system.
The variation of a (whether a > 0 or a < 0) changes the center and the radius of the circle of the equation r = 2asin θ. In fact, the center is (a, 0) and the radius is a.
Here are some graphs when a < 0.
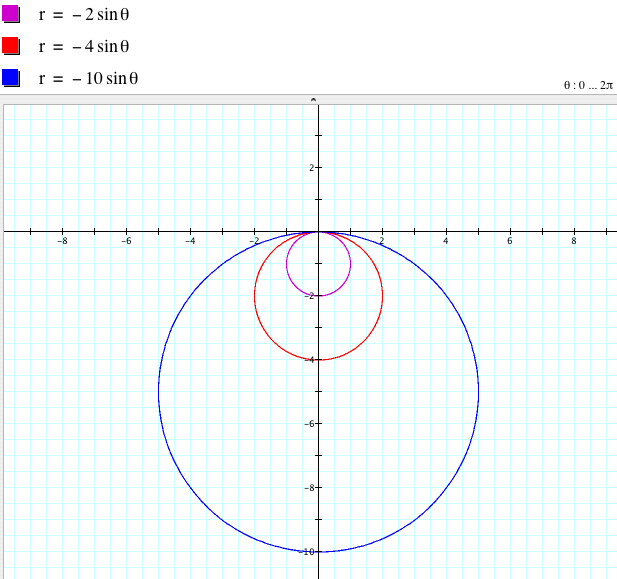
Therefore we observed that a is only related to the center and the radius on the graph of r = 2asin (kθ) when k = 1. If a > 0, the circle is above the x-axis, and if a < 0, the circle is below the y-axis. Since the sine function is an odd function (f(-x) = - f(x)), r = asin(-θ) is the same as r = - asinθ. Therefore when b = 0, and k = -1, we have the similar result except that if a < 0, the circle is above the x-axis, and if a > 0, the circle is below the y-axis.
1.2. The effect of k
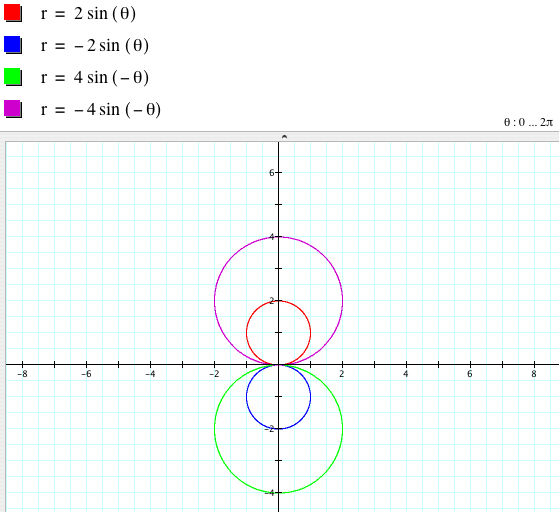
When k = 1, r = 2asin (kθ) is a circle. When k is not 1, is the graph still a circle? No, it is not a circle any more, but in fact, is an n-leaf rose. When k is even, the graph is symmetric with respect to the x-axis (assuming that we overlap two coordinate system), so r = 2asin (kθ) and r = 2asin (-kθ) = -2asin (kθ) have the same graph.
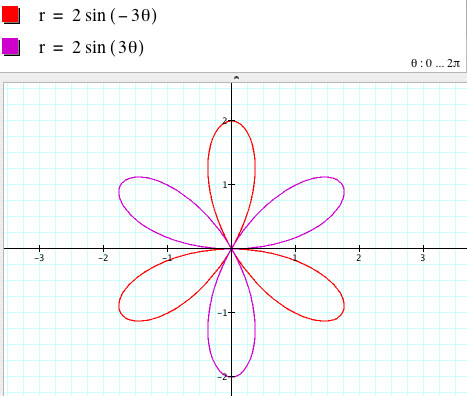
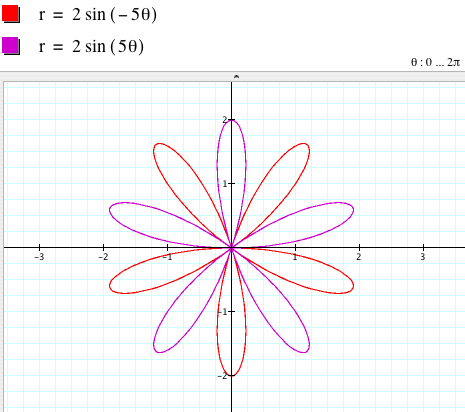
When kis odd, the graphs of r = 2asin (kθ) and r = 2asin (-kθ) are different and symmetric with respect to the x-axis.
The following figures show that a is still related to the size of the graph, and the bigger |a| is, the larger the dilation of the graph is.
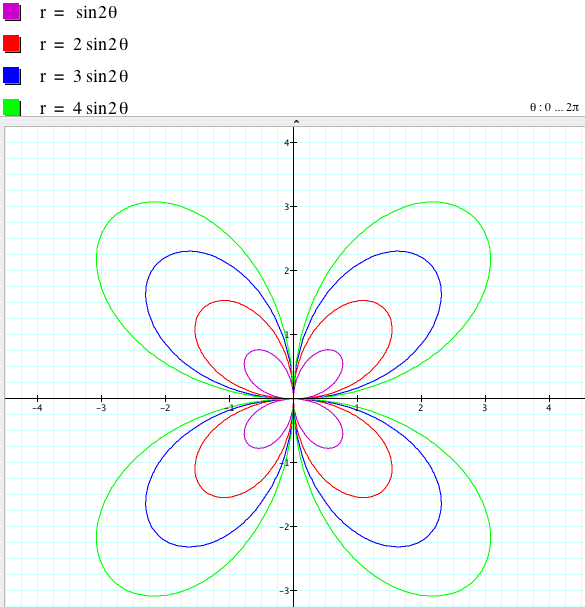
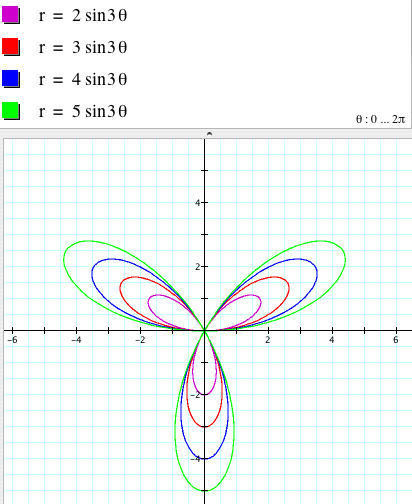
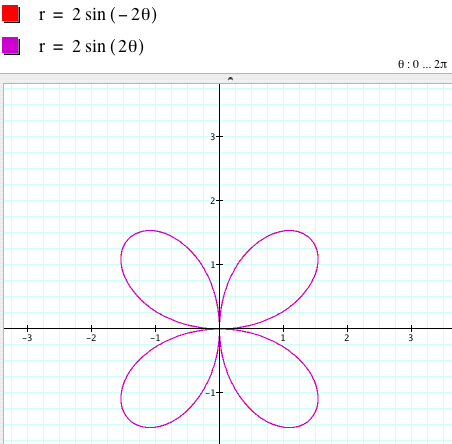
Now fix a = 1 to see more the effect of k on the graph.
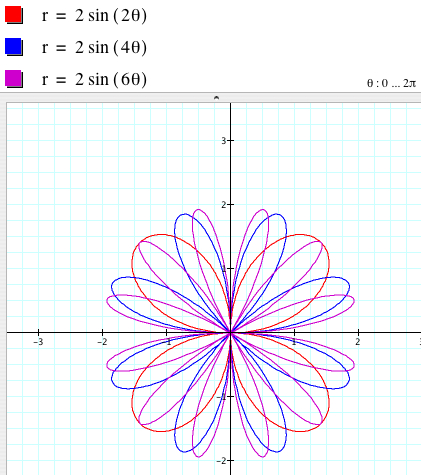
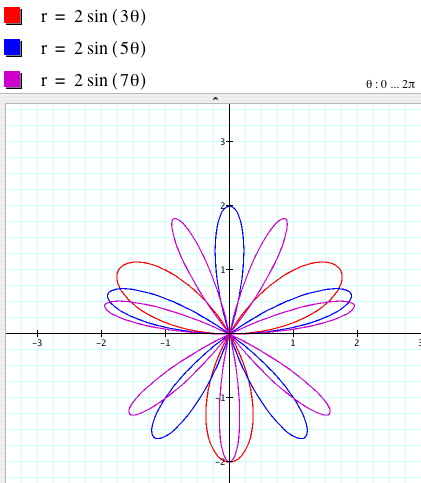
From the figures above, we can say that
r = 2sin (kθ) is a 2|k|-leaf rose if k is even
r = 2sin (kθ) is a |k|-leaf rose if k is odd.
1.3. The effect of b
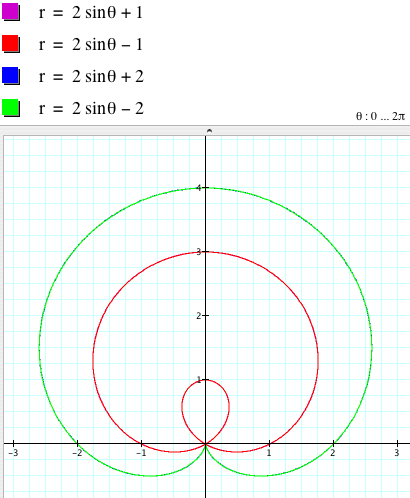
Now let's vary the value of b of r = 2asin (kθ) + b. Reminding the effect of the constant , say c, for the graph of y = f(x) + c in the Cartesian coordinate system, one may guess that b could be related to a shift. But if it is correct, then the issue is 'along what?'. Let's fix a = 1 and k = 1 for simplicity and observe some graphs. First of all, we find that r = 2asin θ + b and r = 2asin θ - b have the same graphs.
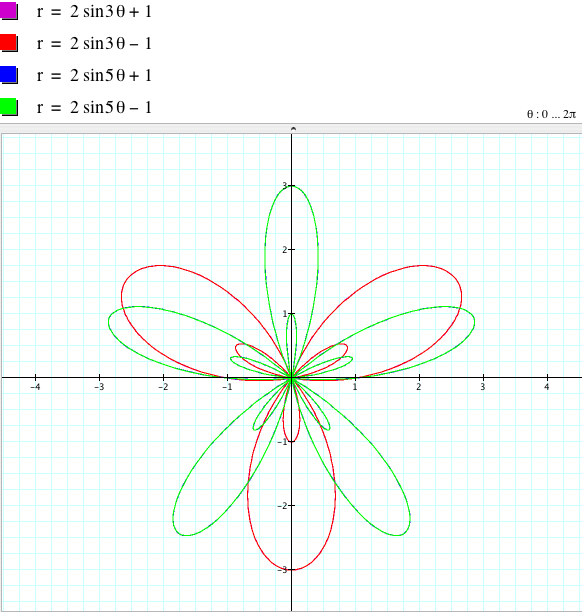
In general, if k is odd, the graphs of r = 2asin (kθ) + b and r = 2asin (kθ) - b coincide, which are symmetric with respect to the y-axis (assuming that we overlap the two coordinate systems, the Cartesian and polar coordinates).
On the other hand, if k is even, r = 2asin (kθ) + b and r = 2asin (kθ) - b are symmetric with respect to the y-axis (assuming that we overlap the two coordinate systems, the Cartesian and polar coordinates).

The following graphs shows that the initial guess for the effect of b was wrong, which means b is not relevant to the shift of the graph.
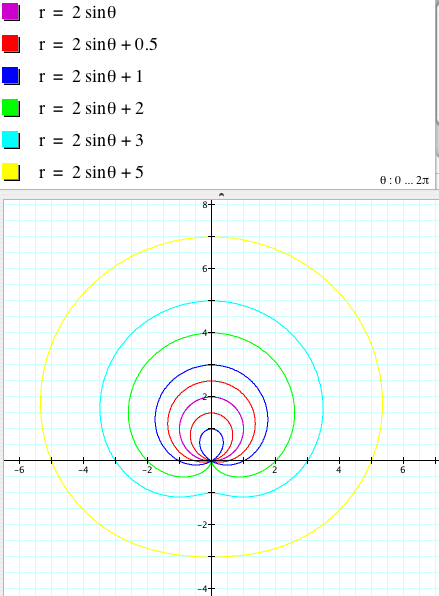
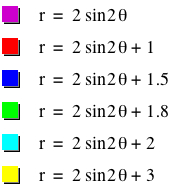
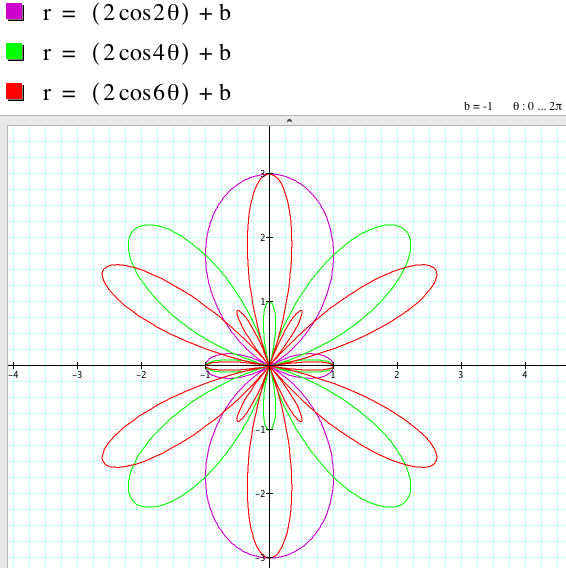
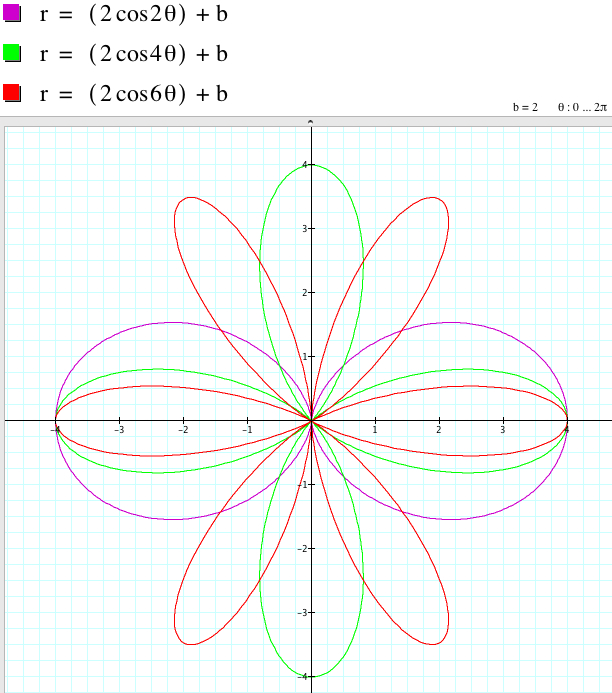
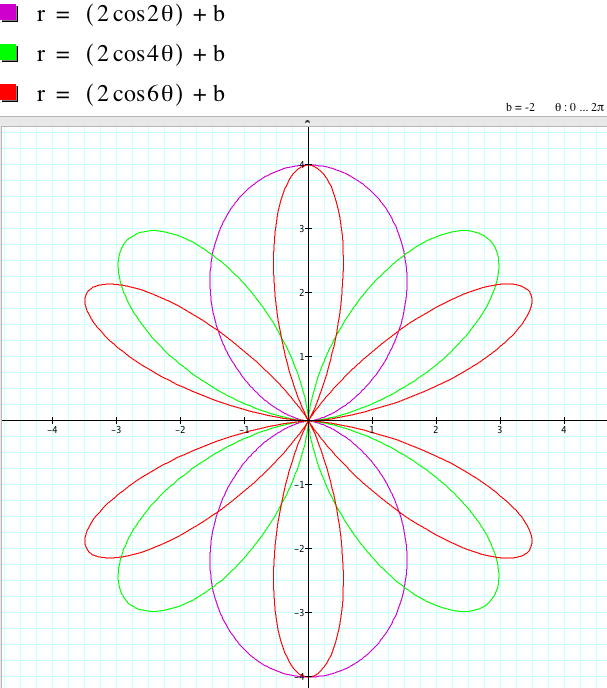
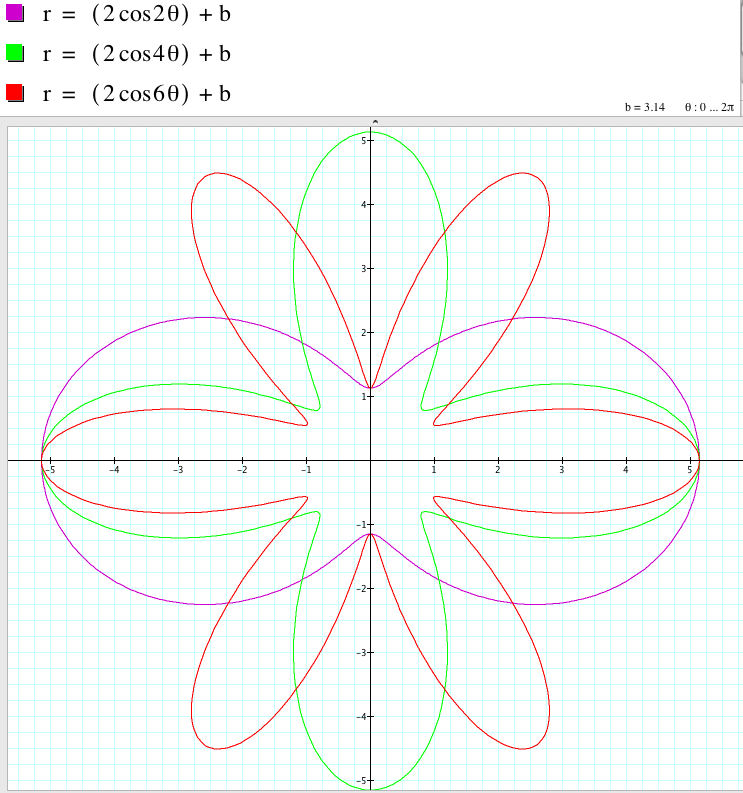
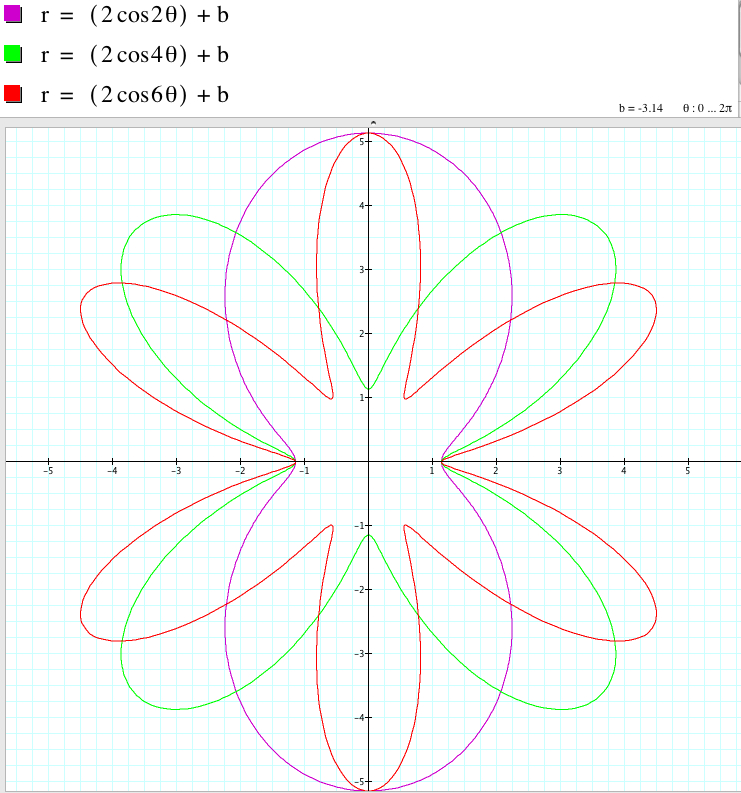
The larger |b| is, the 'larger' the 'size' of the graph is. (Rigorously speaking, this explanation is very intuitive and not quite mathematically correct because the shape of each graph is different.) For example, as b varies, the graph of r = 2sin (2θ) + b is:
To sum up, we have the following:
r = 2asin (kθ) and r = 2asin (- kθ) = -2asin (kθ) have the same graph if k is even
r = 2asin (kθ) and r = 2asin (- kθ) are symmetric with respect to the x-axis if k is odd
r = 2asin (kθ) is a circle if |k| = 1
and the larger |a| is, the larger the circle is.
When k = 1, if a > 0, the circle is above the x-axis, and if a < 0, the circle is below the y-axis.
When k = -1, if a > 0, the circle is below the x-axis, and if a > 0, the circle is above the y-axis.
r = 2asin (kθ) is a 2|k|-leaf rose if k is even.
r = 2asin (kθ) is a |k|-leaf rose if k is odd (exculding 1 and -1).
r = 2asin (kθ) + b and r = 2asin (kθ) - b have the same graph if k is odd.
r = 2asin (kθ) + b and r = 2asin (kθ) - b are symmetric with respect to the y-axis if k is even.
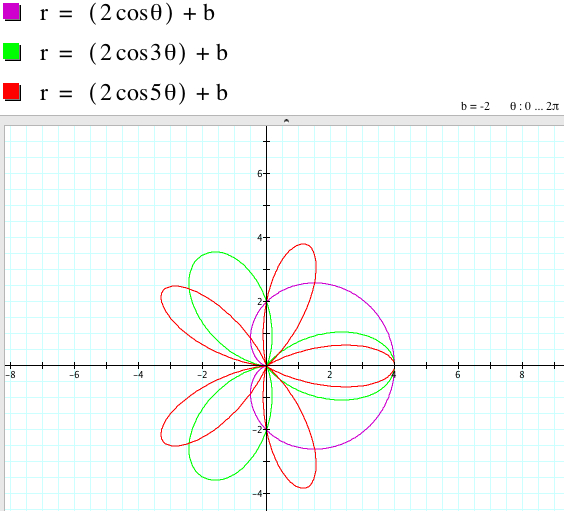
II. Comparing the graph of r =
2asin (kθ) + b, let's investigate
the behavior of the graph of r = 2acos (kθ)
+ b varying the values of (nonzero) a, b,
and k with![]() .
Since the cosine function is even,
.
Since the cosine function is even,
r = 2acos (kθ) and r = 2acos (-kθ)) have the same graph for any k.
Therefore we will consider only positive value k.
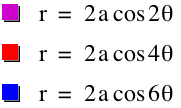
In the animation above, when a varied between -5 and 5, we found that
r = 2acos (kθ) is a circle if |k| = 1
and the larger |a| is, the larger the circle is.
When |k| = 1, if a > 0, the circle is in the right side of the y-axis, and if a < 0, the circle is in the left hand side of the y-axis.
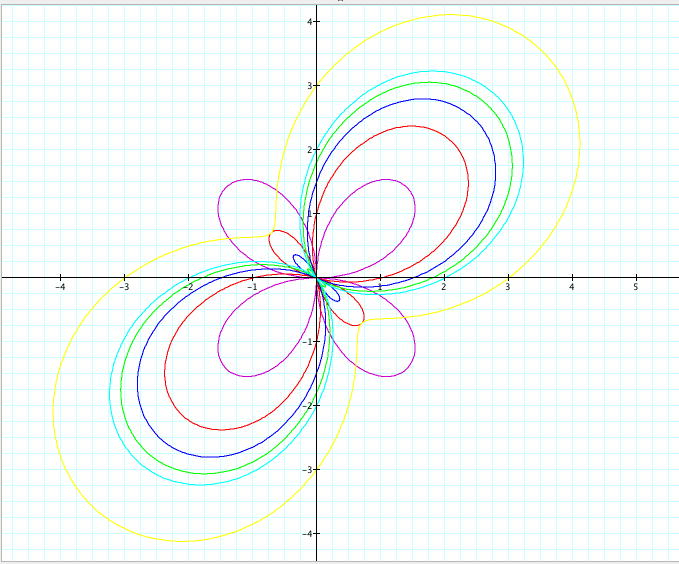
r = 2acos (kθ) and r = -2acos (kθ) have the same graph for any k (exculding 1 and -1).
r = 2acos (kθ) is a |k|-leaf rose if k is odd (exculding 1 and -1).
r = 2acos (kθ) is a 2|k|-leaf rose if k is even.
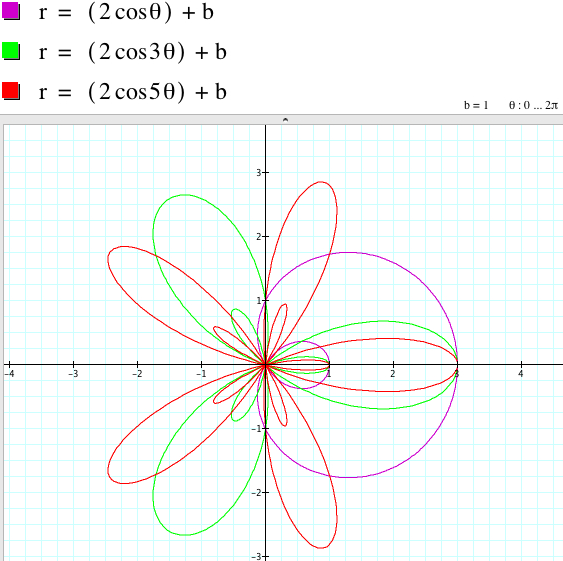
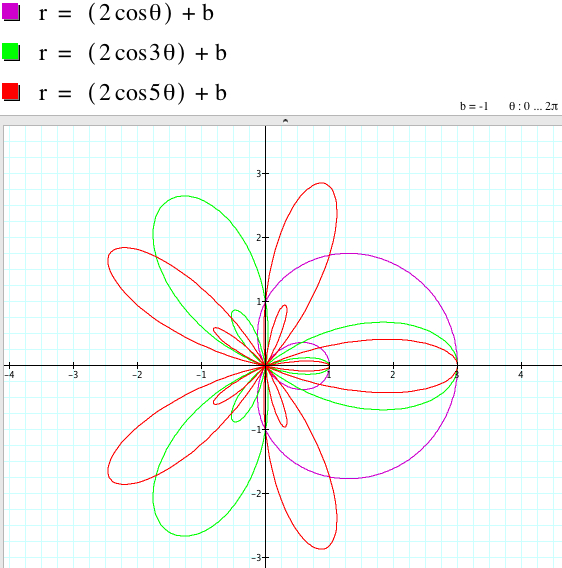
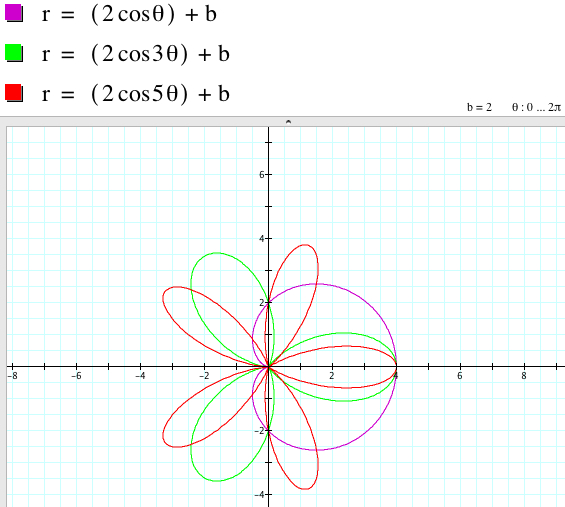
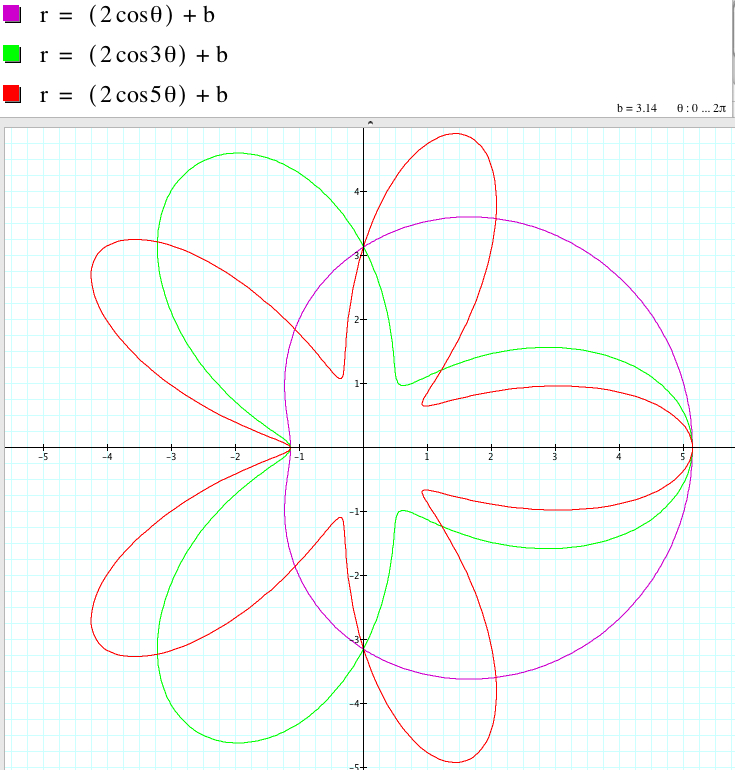
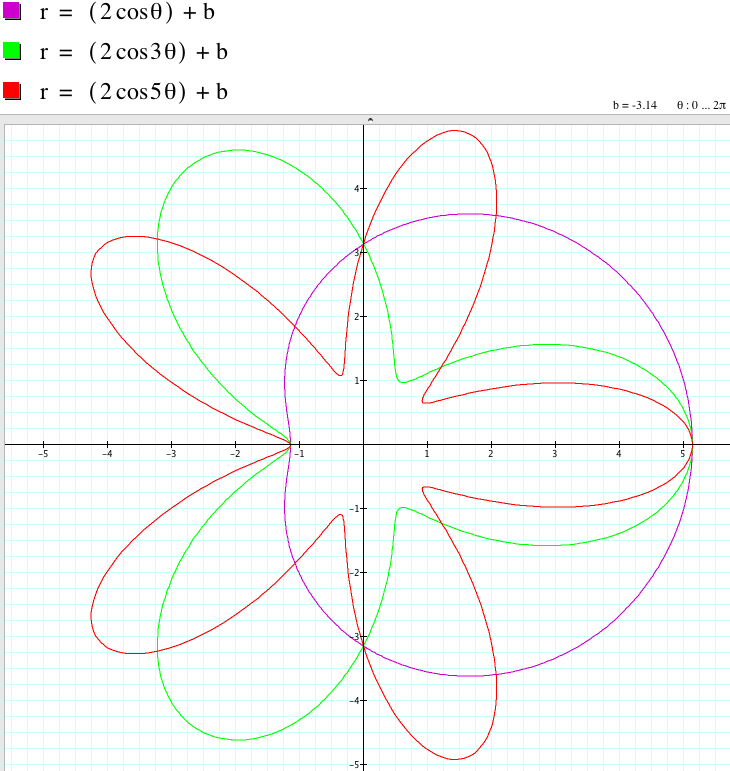
From the graphs above, we have:
r = 2acos (kθ) + b and r = 2acos (kθ) - b have the same graph if k is odd.
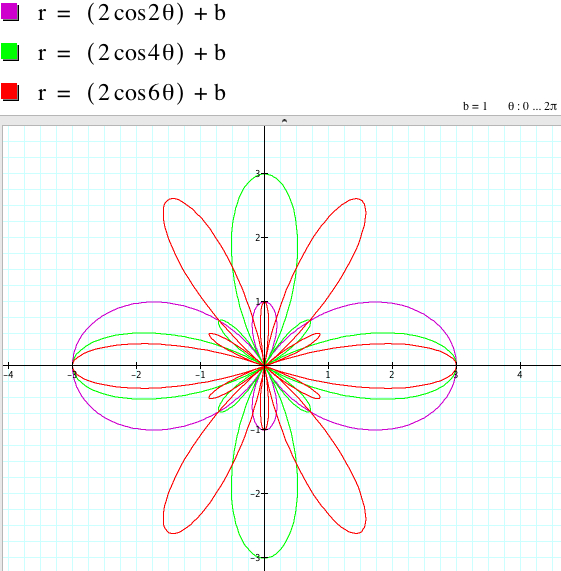
The relationship between the graphs of r = 2asin (kθ) + b and r = 2asin (kθ) - b when k is even involves the rotation with some angles with respect to the origin even though the shape of the graphs coincide.
III. How about the graph of ![]() ?
?
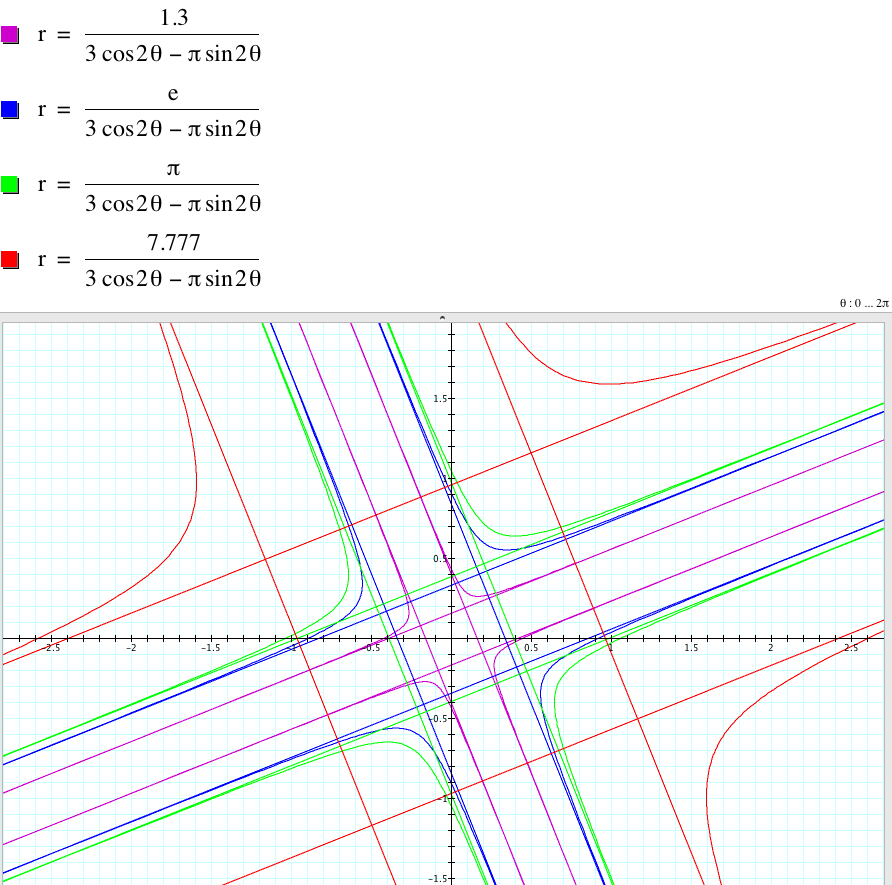
3.1. Let's vary c with a = b and k = 1. When a = b = 1, we have:
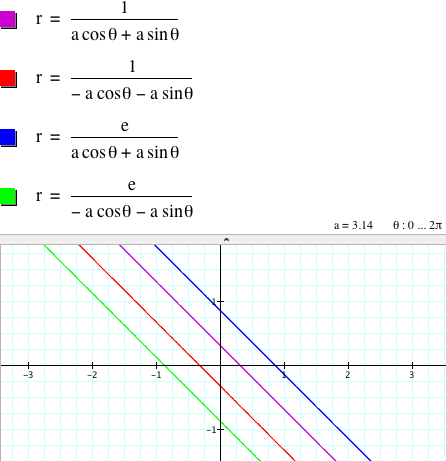
When a = b= -3.14, we have:
As far as a = b
and k = 1, the graph of ![]() is a straight line and c is related to the y-intercepts. If a
= b = 1 or -1, (0, c) and (0, - c)
are the y-intercepts of the graph.
is a straight line and c is related to the y-intercepts. If a
= b = 1 or -1, (0, c) and (0, - c)
are the y-intercepts of the graph.
Since ![]()
![]() ,
we can say that the lines
,
we can say that the lines![]() and
and ![]() have the same slopes, so they are parallel. In fact, the polar equation
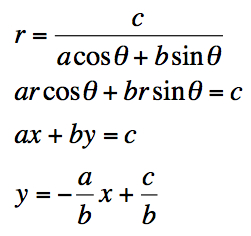
have the same slopes, so they are parallel. In fact, the polar equation ![]() is equivalent to a rcosθ + a rsinθ = c,
so using equivalent relationship with the Cartesian equations we have ax
+ ay = c, which is a line equation
is equivalent to a rcosθ + a rsinθ = c,
so using equivalent relationship with the Cartesian equations we have ax
+ ay = c, which is a line equation
ay = - ax + c
y = - x + c/a
with slope -1 and the y-intercept (0, c/a). That is why whatever a is, as far as a = b and k = 1, the lines are parallel with slope -1.
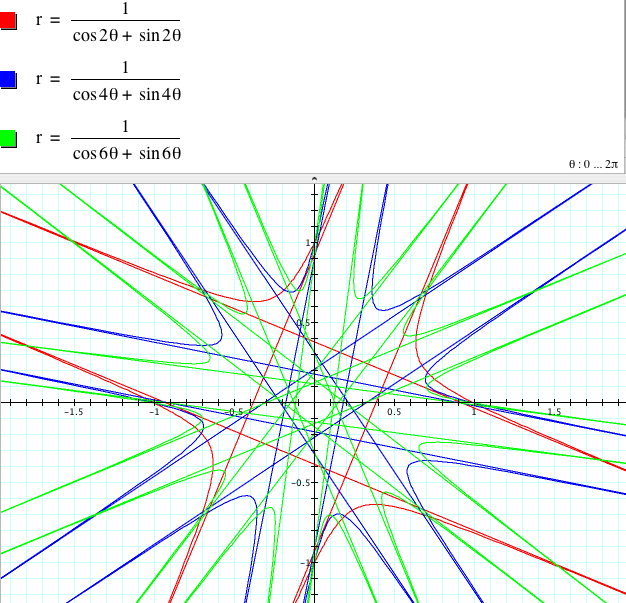
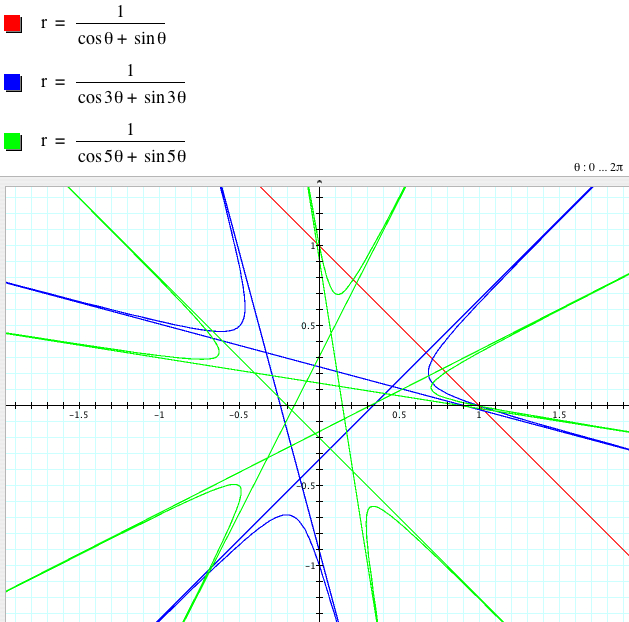
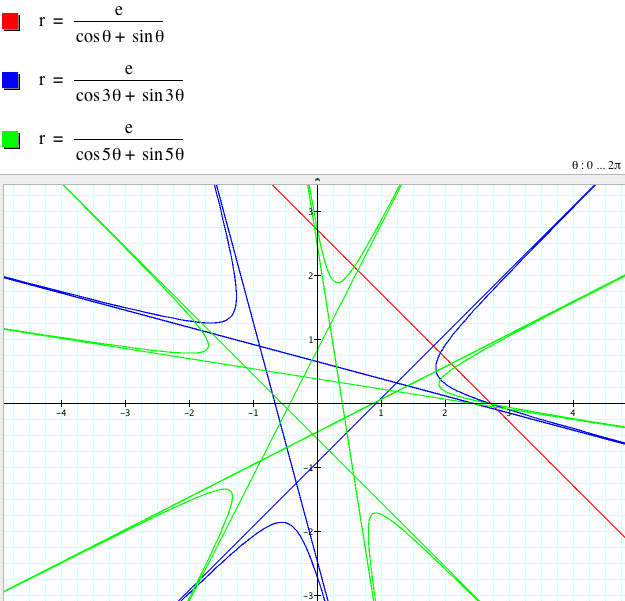
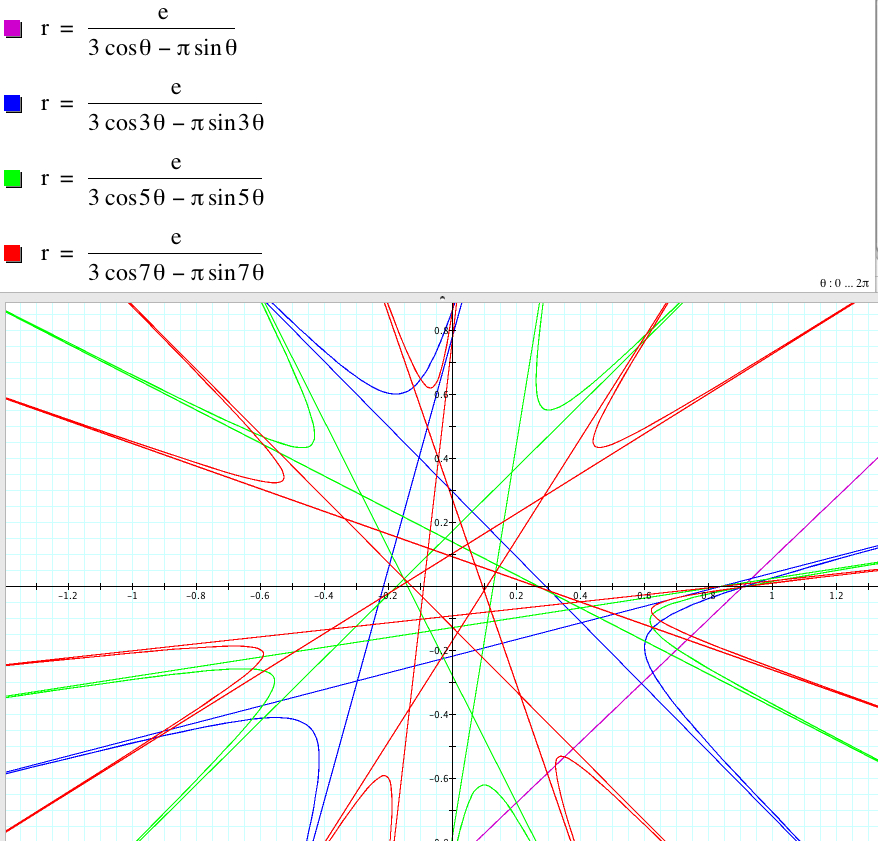
3.2. Let's vary k with a = b and c = 1.
When a = b = c =1,
![]() has
2|k| parabolas with 2|k| asymptotes if k
is even
has
2|k| parabolas with 2|k| asymptotes if k
is even
![]() has
|k| parabolas with |k| asymptotes if k
is odd (excluding 1)
has
|k| parabolas with |k| asymptotes if k
is odd (excluding 1)
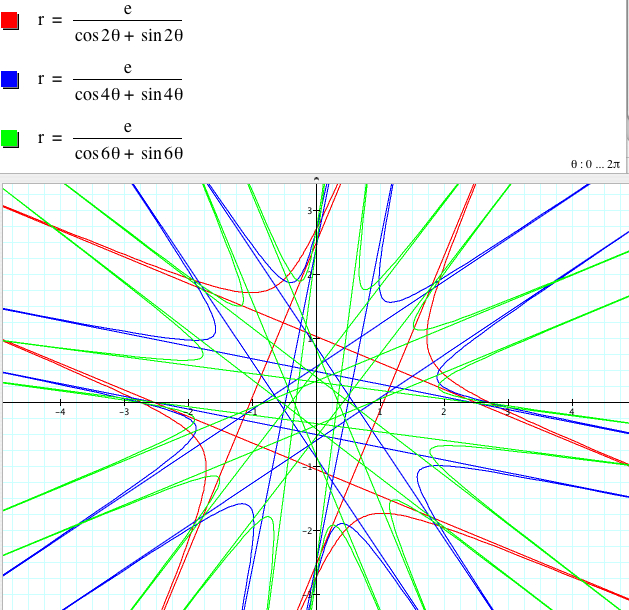
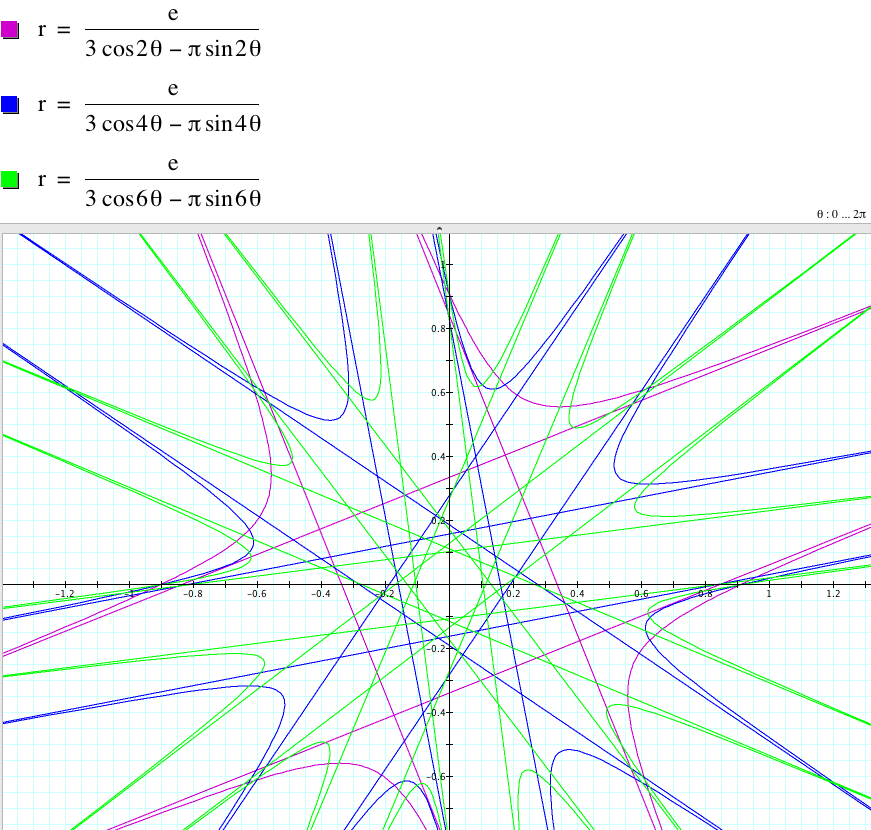
For any c, when a = b = 1, we can still have the same shapes:
![]() has 2|k| parabolas with 2|k| asymptotes if
k is even
has 2|k| parabolas with 2|k| asymptotes if
k is even
![]() has
|k| parabolas with |k| asymptotes if k
is odd (excluding 1)
has
|k| parabolas with |k| asymptotes if k
is odd (excluding 1)
3.3. As far as k = 1, for any nonzero a, b, and c the graph of ![]() is a line because
is a line because
When k = 2,
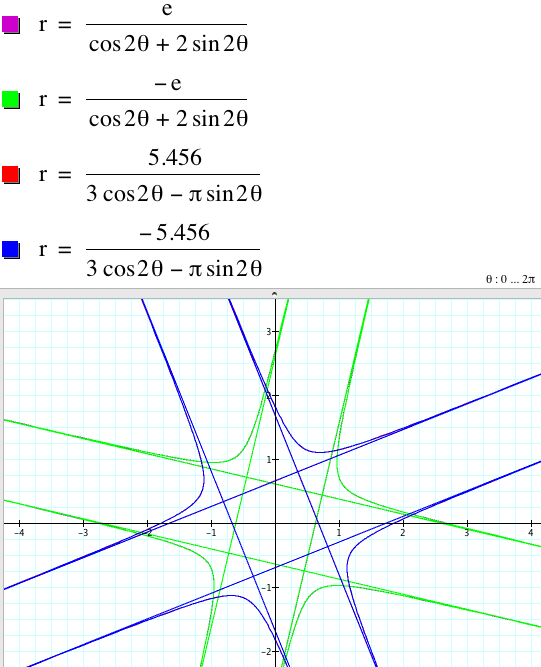
the graphs above show that for any nonzero a, and b, ![]() and
and ![]() have the same graph.
have the same graph.
In addition,
the variation of c does not affect the shape of the graph, and the larger |c| is, the larger the graph is.
In conclusion, we have for any nonzero a, b, and c, and nonzero integer k:
![]() has
|k| parabolas with |k| asymptotes if k is odd (excluding 1)
has
|k| parabolas with |k| asymptotes if k is odd (excluding 1)
![]() has
2|k| parabolas with 2|k| asymptotes if k is even
has
2|k| parabolas with 2|k| asymptotes if k is even