
Exponential Functions
By
Hee Jung Kim
Let’s start with a number e. Mathematician
Euler used the letter e for the first time, so it is sometimes called Euler’s
number.
The number e is defined by the following equation:
![]()
for any positive integer n. If we
put m = 1/n, then e is also defined by the equation:
![]()
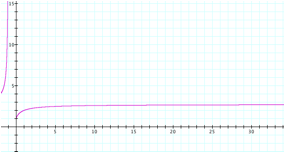
When we look at the graph of the function
![]()
and the behavior of the graph as x
tends to the infinity, we can find that y approaches a value between 2 and 3.
In fact, e is an irrational number and its value is 2.7182818284…
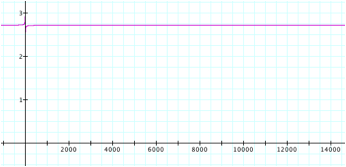
The number e is also the sum of the infinite series
![]()
where n! is the factorial of n. With Graphing
Calculator 3.5 we can play with the upper bound of the summation, for example:
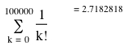
As the upper bound gets bigger and bigger, the sum approaches the
number e.
Now we will observe the effects of nonzero real numbers a and b,
and any real number c on the properties of the graph of the exponential function
y based on e:
y = aebx + c
First, by setting c = 0, a = 1, let’s observe the effects of
nonzero parameter b on the graphs of the exponential function:
y= ebx
When b > 0, let’s explore the graphs.
If b > 1 and increases, the graph is
shrunk horizontally.
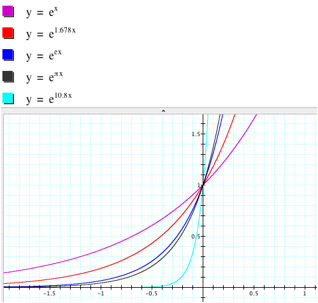
On the other hand, if 0 < b < 1 and
decreases, the graph is stretched horizontally.
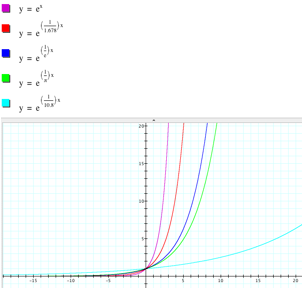
If b > 0, the graph of the exponential
function is increasing viewed left-to-right. The graph is getting closer to 0
without touching the x-axis, so the x- axis is a horizontal asymptote to the
graph.
How is the graph of the exponential function
when b < 0?
If b < -1 and decreases, the graph is
shrunk horizontally.
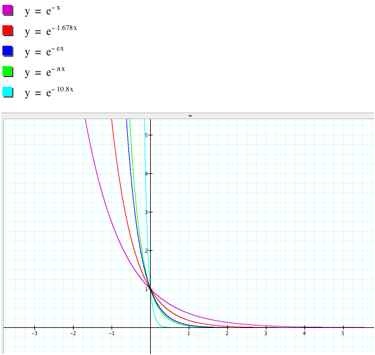
If -1 < b < 0 and increases, the graph
is stretched horizontally.
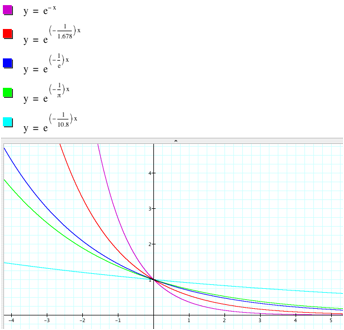
In sum up, when |b| > 1, the graph of y = ebx is a horizontal shrink of the graph
of y = ex, and if 0 <|b|< 1, the graph of
y = ebx is a horizontal stretch of the graph of y = ex.
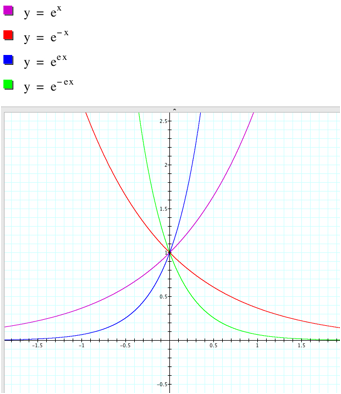
From the graphs, we find that for any nonzero
real number b the domain of the exponential function y = ebx is the set of all
real numbers, and the range is the set of all positive real numbers because the
graph is above the x-axis. The graph always passes through the point (0, 1). In
addition, y = e - bx is symmetric with y = ebx with respect to the y-axis, so is a vertical
reflection of y = ebx.
Now let’s observe the graph of the
exponential function y = aebx when we multiply the function y = ebx by a nonzero
real number a. How does a affect the graph?
For simplicity, we consider y= aex by setting b = 1. If
a > 1 and increases, the graph is stretched vertically.
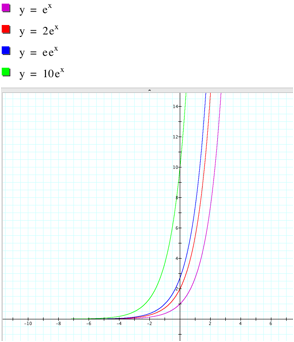
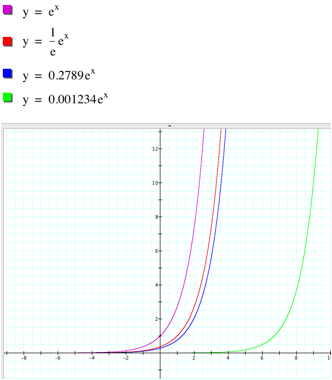
If 0 < a < 1 and decreases, the graph is shrunk vertically.
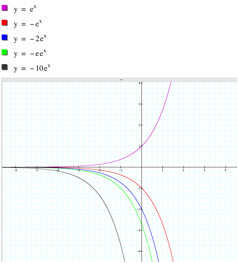
If a < -1 and decreases, the graph is shrunk vertically.
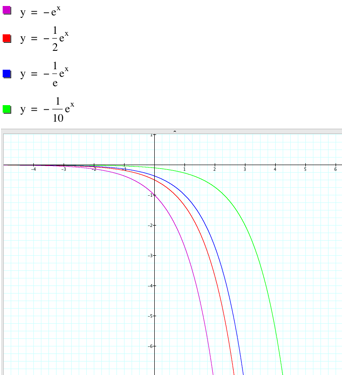
If -1 < a < 0 and increases, the graph is shrunk vertically.
Therefore when |a| > 1, the graph of y = aebx is a vertical
stretch of y = ebx, and if 0 <|a|< 1, the graph of
y = aebx is of a vertical shrink of y = ebx. The graph always passes through the point (0, a). In addition, y
= - aebx is symmetric with y = aebx with respect to the x-axis, so is a horizontal
reflection of y = aebx.
Lastly, let’s observe the effects of parameter c on the graph of
the exponential function y = aebx +
c. For simplicity, let’s set a = 1, and b = 1. When c > 0 and increases, the
graph of y = ex + c is shifted up
along the y-axis., and when c < 0 and decreases,
the graph of y = ex + c is shifted down along the y-axis.
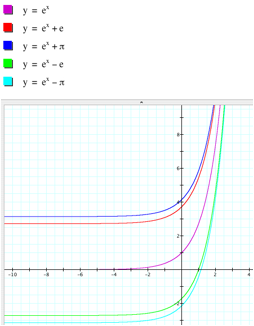
In general, c in the graph of y = aebx + c shifts the graph y = aebx in y-direction upward (c > 0) or downward (c
< 0). Therefore the horizontal asymptote y = c is also shifted from y = 0
and the y-intercept is (0, 1 + c).
In this assignment we observed the effects of nonzero parameters
a, b, and c on the graph of the exponential function y = aebx + c. a is related to
dilation (stretch or shrink) in the y-direction, b is related to dilation
(stretch or shrink) in the x-direction, and c is related to translation (upward
or downward) in the y-direction.