![]()
![]()
Investigation on ![]()
by
Ana Kuzle
I begin my investigation by plugging in several values for a.
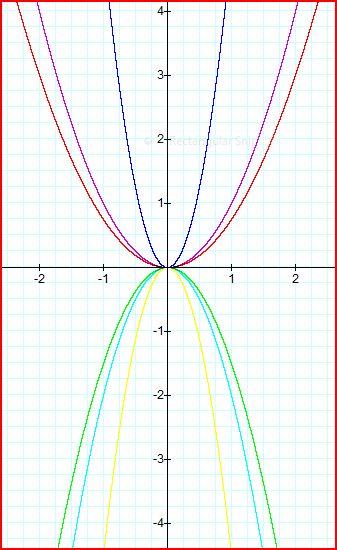
So, we can see that the value of a influences whether the graph of the function ![]() is above or under x-axis. If a>0, then the graph is above x-axis because a is positive and x^2 is positive for all real x. Therefore, value of y is always positive.
is above or under x-axis. If a>0, then the graph is above x-axis because a is positive and x^2 is positive for all real x. Therefore, value of y is always positive.
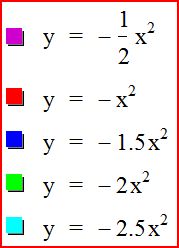
If a<0, then the graph is under x-axis because a is negative and x^2 is positive for all real x. Therefore, value of y is always negative.
Animation shows it very nice.
The graph of a given function has only one zero-point and that point (0, 0) is because ![]() .
.
I continue my investigation on how a>0 influences given function.
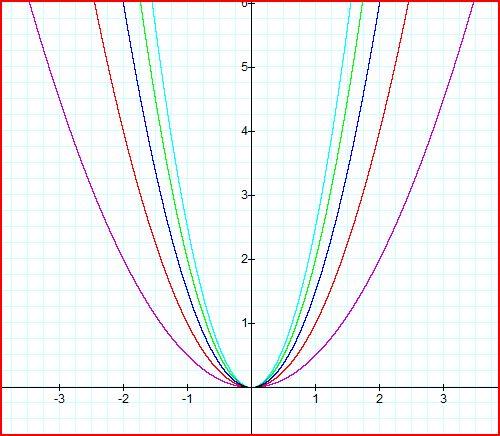
We can see also in the animation that the value of a influences how 'open' is the graph. As positive a becomes bigger the graph is less open, i.e. it gets closer to y-axis. As positive a becomes smaller, the graph is more open, i.e. it gets more close to x-axis (grows more rapidly to infinity).
The same reasoning applies for a<0. But, as negative a becomes bigger the graph is more open, i.e. it gets closer to x-axis (grows more rapidly to negative infinity). As positive a becomes smaller, the graph is less open, i.e. it gets less close to y-axis as shown here.
From both cases we can see that the graphs are symmetrical with y-axis being its axis of symmetry. Why is that?
![]() . Thus,
. Thus, ![]() is an even function.
is an even function.
Afterwards, I was interested how opposite values of a influence graph of ![]() .
.
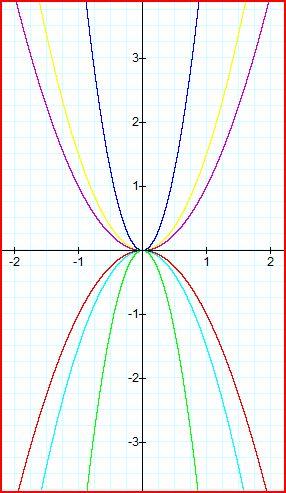
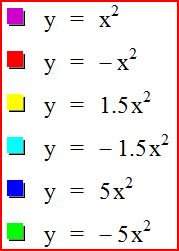
We can see that for given opposite values of a, graphs of the given function are symmetrical where x-axis is its axis of symmetry.