
Voronoi diagrams
by
Ana Kuzle
Since I moved to America I fell in love with fast food, unfortunately. Having a map of Athens, or any other city, with sets of points representing any fast food restaurant from Arby's to Zaxby's would enable me to find the closest one at any given time and any given point in Athens. Even though they are all pretty much the same when talking off quality, offer and price, going to Wendy's is my favorite junk food chain. Hence, having again a map of Athens and its nearby area (my Voronoi diagram) I would be able to know the path to the closest Wendy's. My problem would merely be locating the intersecting lines representing my walk with the cell that surround particular fast food restaurant.
Even though Voronoi diagrams were first investigated by René Descartes in the 17th century and applied by Dirichlet when exploring quadratic forms, the diagrams were named after Georgy Voronoi. Voronoi was a Russian mathematician well known in number theory and his contributions with respect to continued fractions.
What is a Voronoi diagram? Let P be the set of n distinct site points in the plane. The Voronoi diagram of P is the decomposition of the plane into n cells, called Voronoi cells or Dirichlet domain, one for each point. A point q lies in the Voronoi cell corresponding to a site point p_i if the Euclidean distance d(q, p_i)<d(q, p_j), for every p_i in P, i not equal to j. Or in other words, decomposition of a plane into convex regions all revolving around one generated point and every point in the convex regions closer to the generated point than to any other points is called a Voronoi diagram.
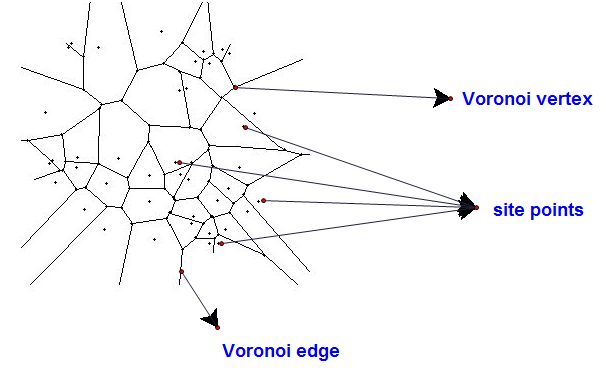
The Voronoi diagrams have widespread applications in computational geometry, city planning (e.g. building schools), computer graphics, epidemiology, geophysics, and meteorology. They were even the central idea in the TV series Numbers. But before we go to numerous applications of Voronoi diagrams let us first explore the diagrams.
How would we construct a Voronoi diagram?
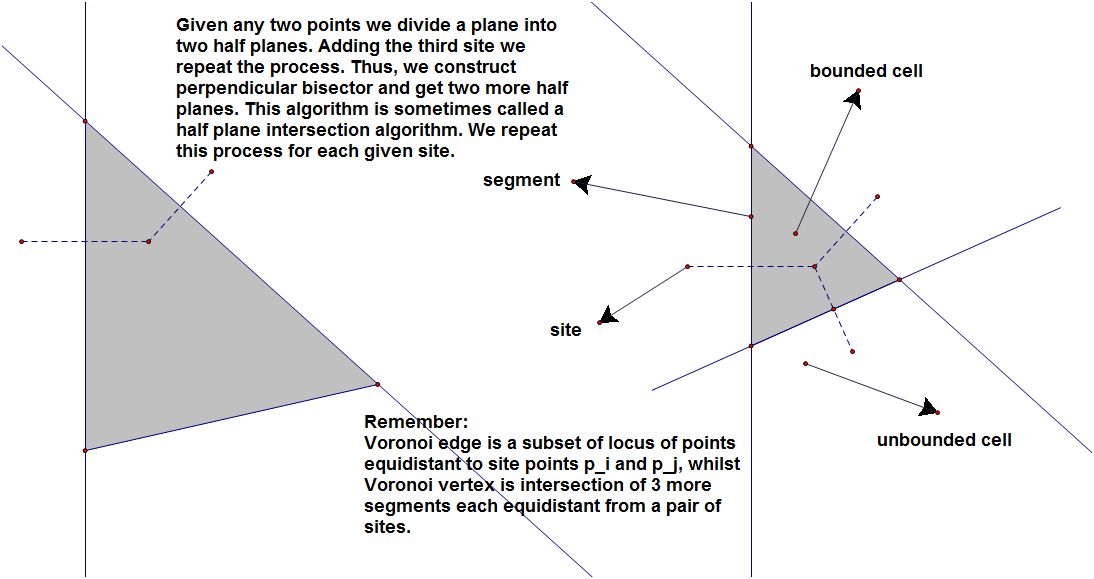
Looking back at the definition of the Voronoi diagram we can easily construct the diagram. We will here shown and explain when the points are collinear and non collinear.
How does the Voroni diagram looks like when we have 2, 3 or more collinear sites?
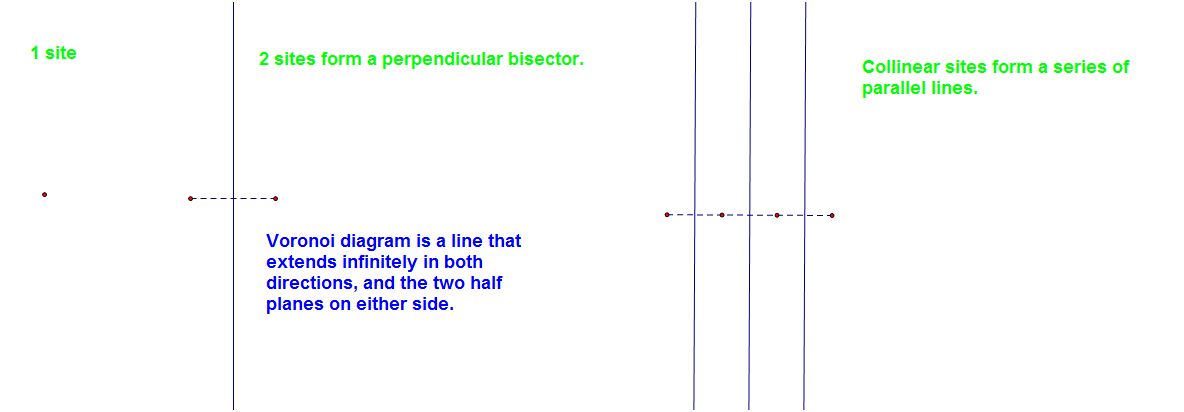
How does the Voroni diagram looks like when we have set of non collinear sites?
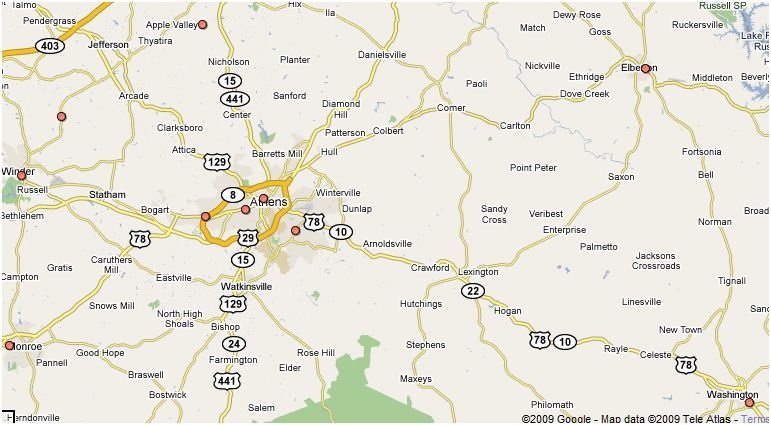
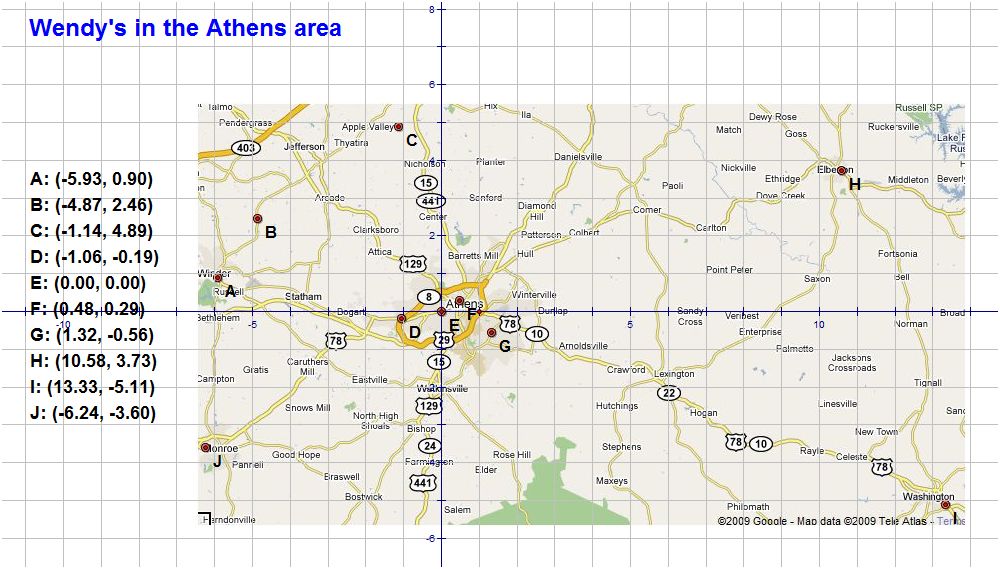
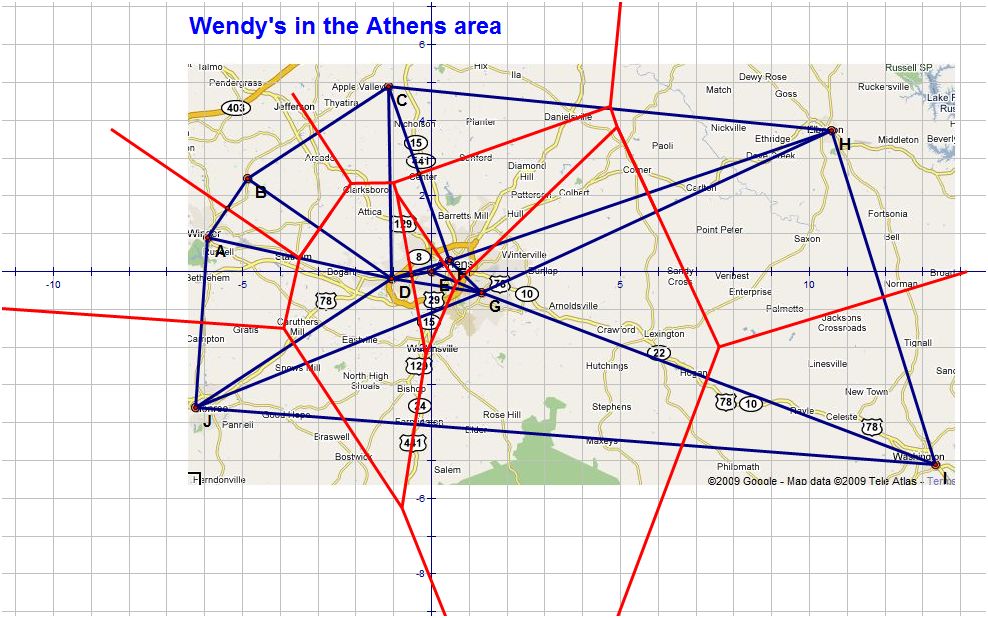
Now when we know how to construct a Voronoi diagram let us try to solve a real life problem. As said in the beginning, I am a huge fun on Wendy's, and since I travel a lot around Athens I want to know where is the nearest Athens depending on my location in the nearby Athens area. The picture below in the map of surrounding area of Athens. In the picture you can also notice red dots. You can probably guess that those represent Wendy's. For instance, if I am located in Statham should I go to Winder or to west side of Athens to grab my favorite chicken sandwich? Or more importantly have I been going to the nearest Wendy's from my apartment this entire year?
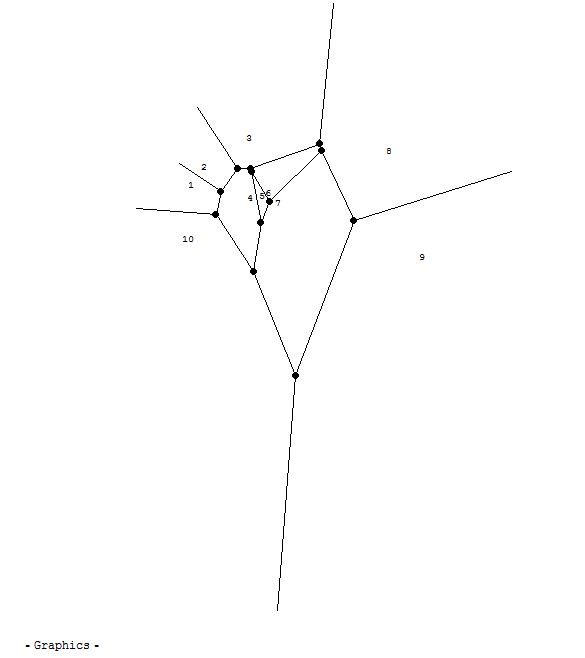
Let's try to construct a Voronoi diagram for the Greater Athens area. Notice that the red dot or points which we said represent Wendy's are indeed Voronoi vertices. We need to construct Voronoi cells and its set points because then we know that the distance between the site point and any point inside the cell is smaller than any other distance. In order to do that we will use a process called Delaunay triangulation often used in computation geometry named after Boris Delaunay, Russian mathematician, in 1934. Triangulation T(P) for a set P of n points in the plane, not all collinear, is a planar subdivision of the convex hull of P into triangles with vertices from P. The Delaunay triangulation for a set P of point in the plane is a triangulation DT(P) such that no point in P is inside the circumcircle of any triangle in DT(P). More importantly, the Delaunay triangulation DT(P) is the straight line dual of the Voronoi diagram. Thus, vertices are sites of the Voronoi regions, and edges are segments between any two points neighboring Voronoi regions. Each Voronoi vertex is the center of a triangle of the Delaunay triangulation.
I placed the map of Athens in a coordinate system. By doing that I got coordinates from all of the 10 Wendy's that are in the surrounding area.
Since the rules of triangulation are not that complex but the process can become messy manually, I did the triangulation using another software called Mathematica. Using that software, giving the program 10 coordinates it gave me back the Delaunay triangulation of the plane bounded by those points.
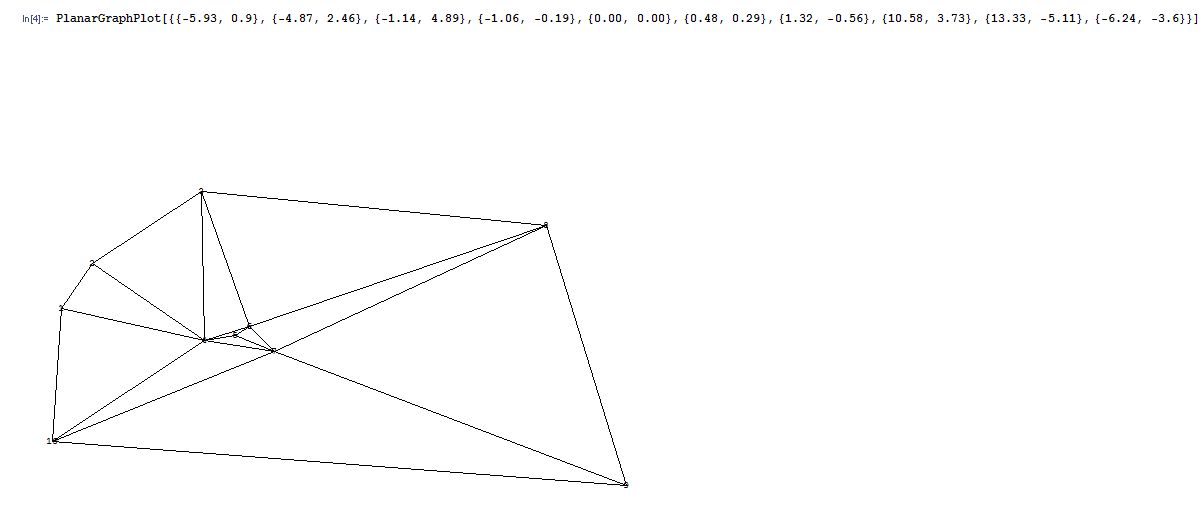
If we apply this to the map of Athens we get the following:
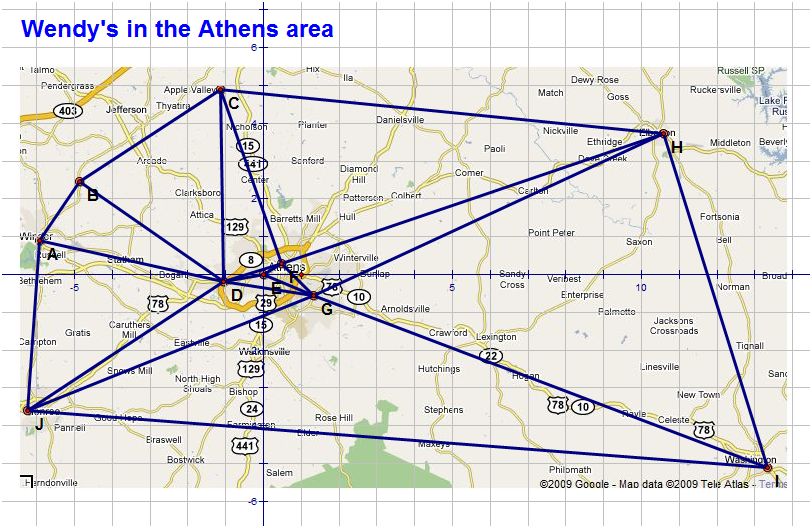
Once we did the Delaunay triangulation we are rest with doing the Voronoi diagram. But that part is trivial and explained already above. We just need to construct perpendicular bisectors of each triangle. Connecting the centers of the circumcircles produces the Voronoi diagram (in red). Below you can see what Mathematica calculated.
 |
 |
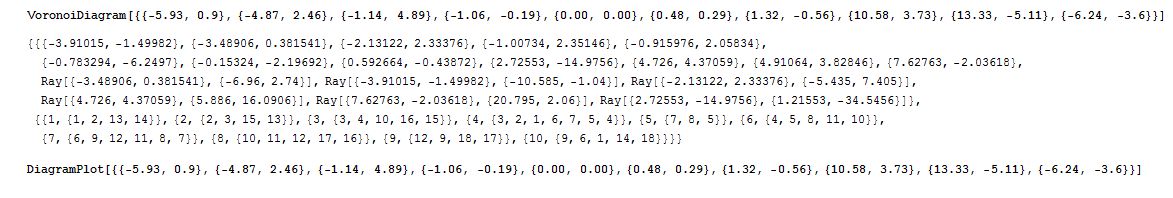
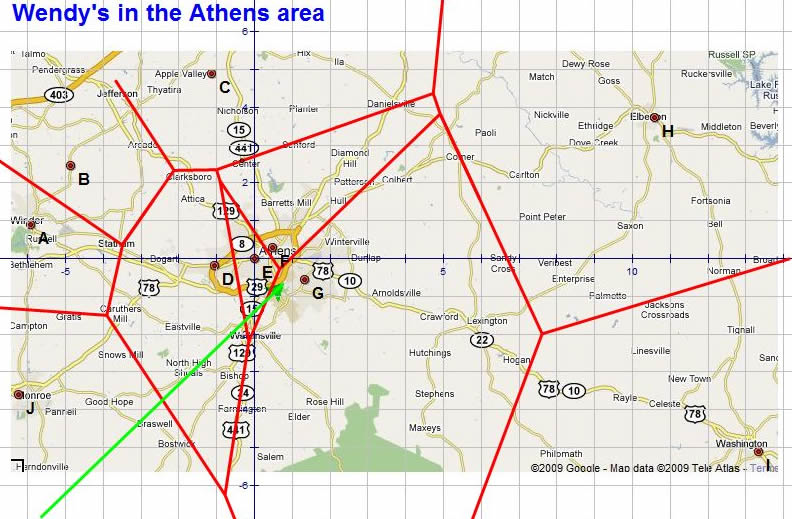
And here is the Voronoi diagram of the Athens area.
There are 4 Wendy's in Athens: on Alps Road (E), Barnett Shoals Rd (G), Prince Ave (F) and Huntington Rd (D). The tip of the green arrow is where my apartment is located. I am proud to say that all this same I have been going to Wendy's on the Barnett Shoals Rd (G). Thus, to the nearest one.
 |
 |

It's waaaaay better than fast food. It's Wendy's.