
Parametric Equations
by
Becky Mohl
For various a and b, investigate the following parametric curve,
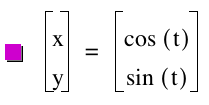
x = a cos (t)
y = b sin (t)
for 0 < t < 2 pi (6.28
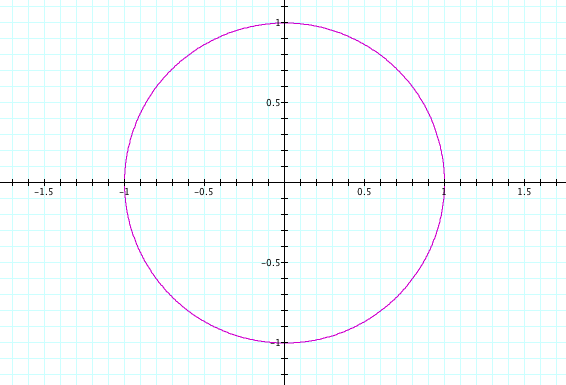
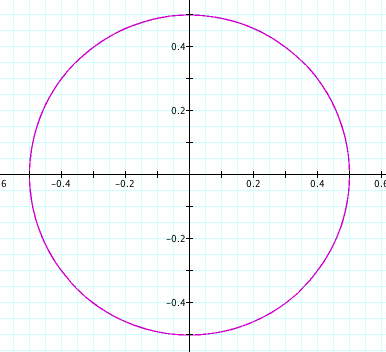
Here in the above picture is a graph of a circle. When we look at the equation for the circle, we see that the values in front of the sin(t) and cos(t) are both 1; therefore, a and b are both 1. Lets graph another to see if we make the assumption that if a = b then we have a circle.
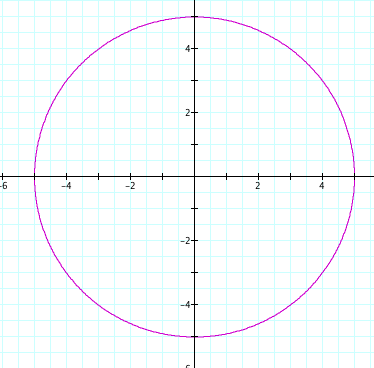
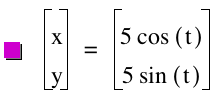
Again the above picture gives us a circle, and both a and b are 5; therefore, a = b, and we have another circle.
Because of this observation, we can go on to explore more graphs where a = b, and should always find that it graphs a circle given a parametric equation. Thus, we can assume that when a = b, the graph will yield a circle. Another observation that I notices is that in the first graph a and b equaled 1, and the graph intersected the points (1,0), (-1,0), (0.1), and (0,-1). This also held true for the second graph where the points (5,0), (-5,0), (0,-5) and (0,5) were intersections of the graph.
Now let's see what happens in a parametric equation when a does not equal b.
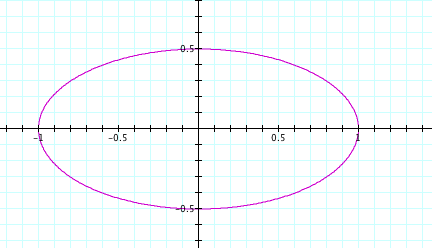
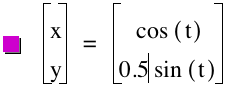
In the above graph, we changed our coordinates where a did not equal b. This time we let a = 1 and b = .5, and we found that the graph yielded an ellipse; however, the coordinates still followed the equation. When x = a sin(t) and a =1, the x coordinates were (1,0) and (-1,0). As follows, y = .5 cos(t), and the y coordinates were (0, .5) and (0, -.5). Again let's look at one more graph before making an assumption.
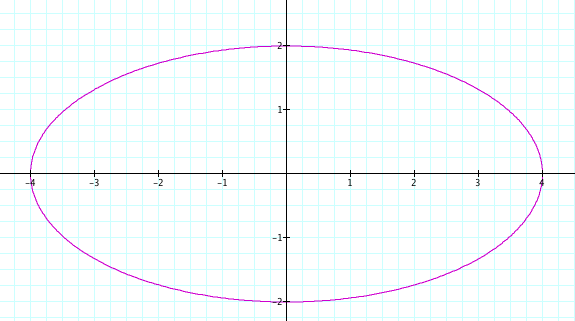
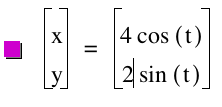
Yes, again we see that the graph yielded an ellipse because a did not equal b. Also once again, the x and y coordinates were the same as a and b. The y coordinates were (0,2) and (0,-2). As the x coordinates were (4.0) and (-4,0). Thus we can assume that if a is not equal to b, the graph will be an ellipse.
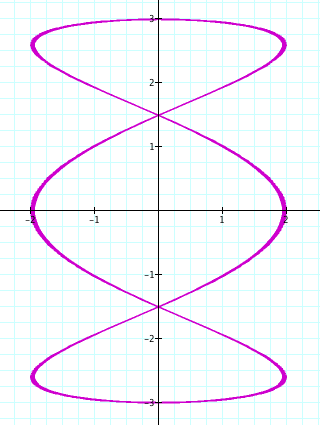
Lets try to change other options and look at their graphs. Let's start by considering the parametric equation
x = a cos (ct)
y = a sin (ct)
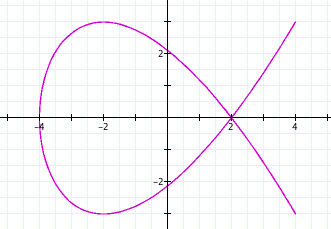
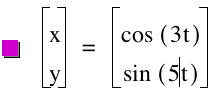
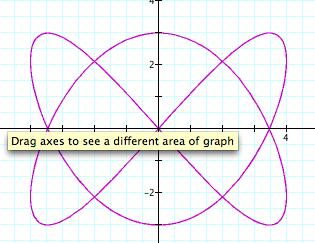
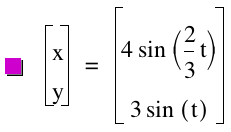
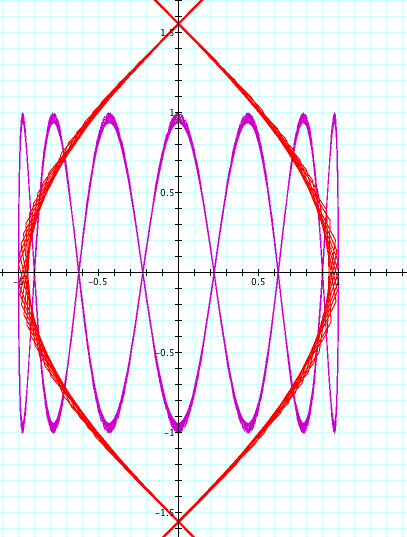
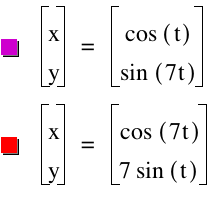
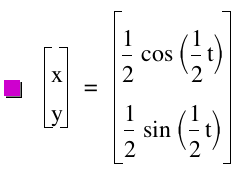
Here are some more investigations over the parametric equations.
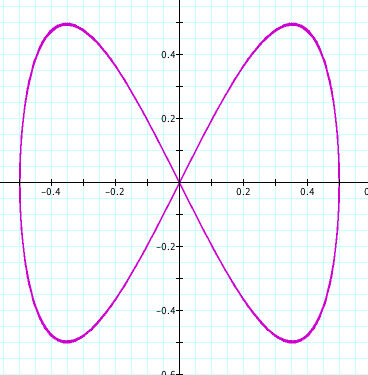
 t: -50...50
 t: -10...10
 t: -50...50
 t: -10...10
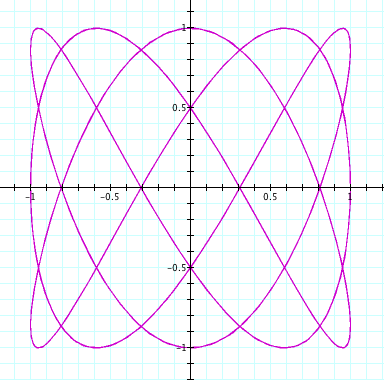
 t: -10...10
 t: -10...10
 t: -50...50
 t: -10...10
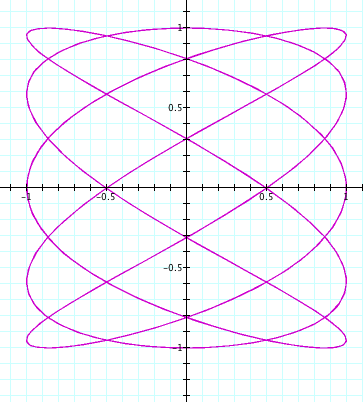
In the last picture, we see that no matter how many fractions of a = b = c = d, then we will have a circle just as in the first equations.
Also, no matter what parameters we put, we will always have a rectangular box around our graph which we see in each picture that is above. In addition, if you continue to investigate these parametric equation, you can make some pretty cool and abstract thing, try it yourself!!
Back