
Parabolas
by
Becky Mohl
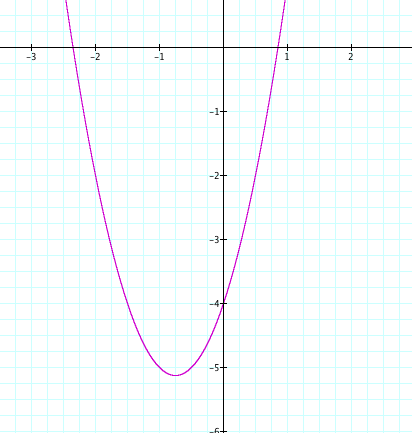
Graph the parabola y = 2x^2 + 3x - 4.
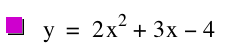
Now lets change all of the x's in the equation to (x-4) and see what happens to the graph.
As we see in the graph above, the vertex moved over into the 4th quadrant from the 3rd quadrant. Why did it do this? Well lets find out. In order to discover why hte graph translated over to another quadrant by graphing another equation, and seeing what happens to the graph this time.
This time instead of changing the x's to (x-4) lets try to get a graph that has its vertex in the 2nd quaadrant. Since the 2nd quadrant is just above the 3rd quadrant lets try to add something to the graph to move the graph up. Lets think what number we should add. Well we know that 4 - 4 = 0, but we do not want thevertex on one of the axis' therefore, lets add a bigger number. Lets try 8 which is 4 + 4 = 8.
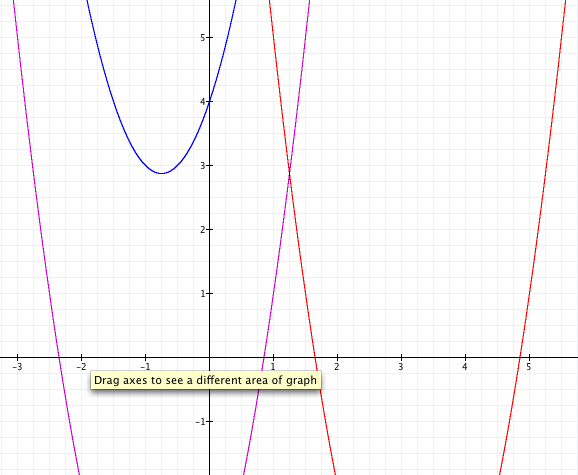
Hooray, we did it. The graph has its vertex in the second quadrant. Now lets remember what we did. When we changed x to (x-4) the graph moved to the right, and when we added 8, the graph moved up. Lets see what happens one more time.
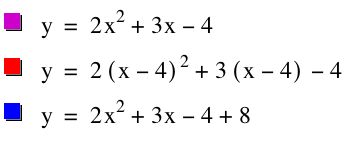
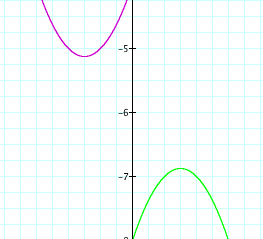
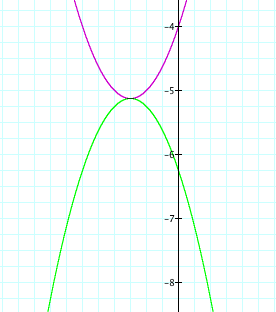
This time we want to flip the graph so that it is concave down, but still has the same vertex as our original graph, y = 2x^2 + 3x - 4. Lets see what happens when we first flip the graph so that it is concave down. In order to this, we simply make the equation negative without chaging any of the values.
Here we see that the graph is indeed concave done; however, it does not share the vertes with our original graph. In order to translate the graph over and down lets think about what we need to do. When we added 4 to the entire equation the graph moved up, and when we reoplaced x ith (x-4) the graph moved to the right. Lets try subtracting 4 from the graph sems we added 4 earlier. Here is waht happens when we add 4.
In the above graph we see that adding 4 to the graph moved the vertex down too far, so lets try another number. Lets try 2. Also, in order to move the graph to the left lets try to make the 3x negative in attempts to translate the graph.
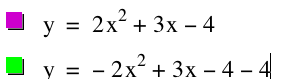
We are almost there. Now all we need to do is try numbers between 2 and 4 that makes the graph meet at the same vertes as the original graph. After several attempts, we find that 2.25 satisfies that requirement. We see below that the green graph is concave down and that the vertices are at the same point.
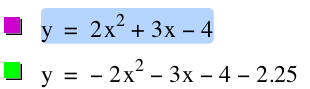
Now lets remember what we have done over the last few steps in order to translate the graph. We know if we look at one of the simplest equations of y = x^2. We know that when we added 1. y = x^2+1 this caused the graph to translate upward. In fact, it translates the graph up 1 unit because we added by one. On the other had, if we subtract by 1, then the graph moves downward 1 unit. To make things a little bit tricky lets see what happens when we add and subtract 1 to the x value. when we changed x to (x-4), the graph moved to the right. This is because the negative moves the graph to the right. Consider, y = (x-1)^2. This moves the graph over to the right 1 unit as (x+1)^2 will move the equation over to the left 1 unit. This holds true for every graph.
Back