Investigation of Second Degree Equations
by
Jackie Ruff
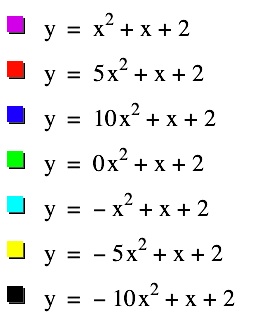
We will begin this investigation by considering what happens to the graph of y = ax2+x+2 as the value of a changes.
 |
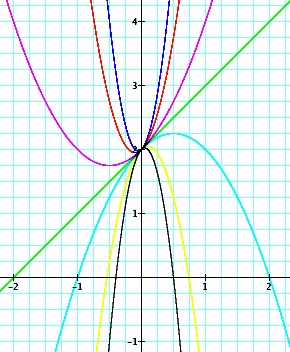 |
We can tell that as the value of a increases, the width of the parabola decreases. Another way to say this is that the sides of the parabola become steeper. The only point that remains constant in all of these functions is the y-intercept, (0,2). When the a value becomes zero, the graph is a line with a slope of 1 and a y-intercept of 2.
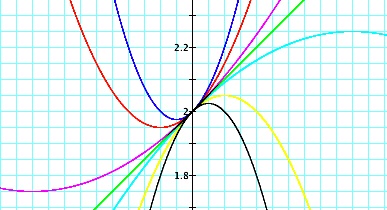 |
We can see from the view at the left that the green line, y=x+2, appears to be tangent to all of the parabolas at the point (0,2). |
Next, we will consider equations of the form, ax2-1y2+ x + y + 1= 0 as we change the value of a. Consider the graphs below.
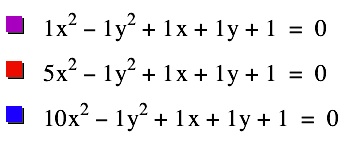 | 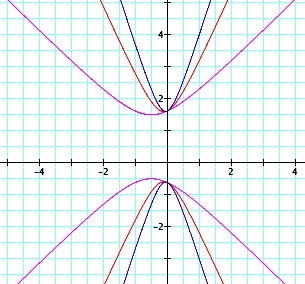 | We can see that as the value of a increases, that hyperbola becomes narrower, as the parabola did, and that the vertices move closer to the y-intercepts. |
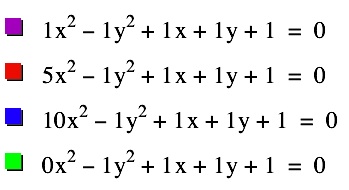 |  | The parabola appears to be tangent to each part of the hyperbolas at the y-intercepts. |
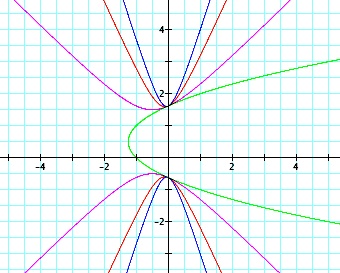
| Here we can see the parabola (green) intersecting the top half of the hyperbolas at some point(s). If we look at the table of values at the right we see that all of the graphs have the point (0, 1.62) in common. If we look at values close to the point, in the table below, it becomes evident that this is the only point that is common. |  | 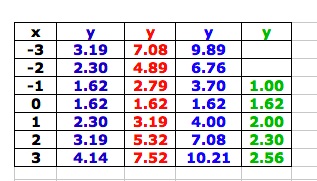 These values are rounded to two decimal places. |
| The table just to the right shows that looking at values close to zero, the only point in common seems to be (0, 1.62). Having an even closer look, in the table at the far right, our point of tangency seems to be, more precisely, (0, 1.6180). | 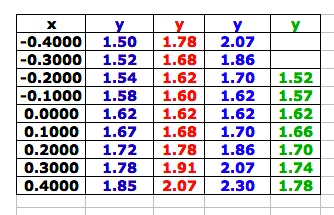 | 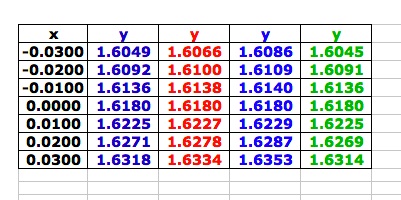 |
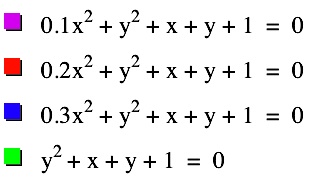
We should probably consider graphs of the form ax2+1y2+ x + y + 1= 0 to see if this pattern of finding a tangent to the curves by letting a = 0 continues.
| It looks as if the set of ellipses might be getting closer to the parabola or to some specific location on the right side. But after having a closer look, below, we see that as the value of a increases the ellipses pull away from the parabola. | 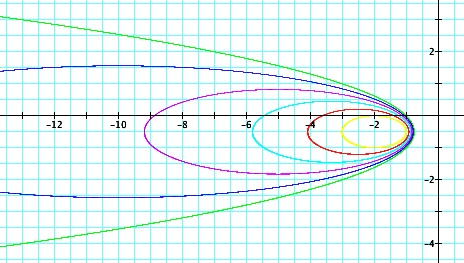 | |
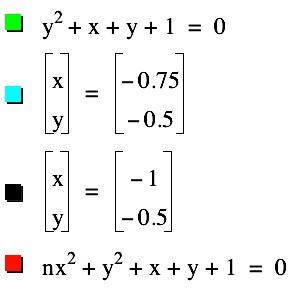
 | 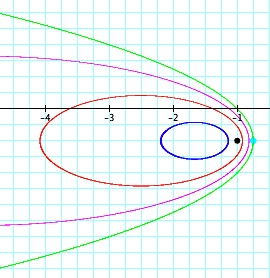 | We can see in the graphs to the left, that when a=0, we have the graph of the green parabola. As the value of a
increases, we have ellipses decreasing in size. Between a=0 and
a=1, around a = 0.34 the equations begin having no real solutions. It
seemed that the decreasing ellipses might be getting closer and closer
to the focal point of the parabola, but that point is marked in black
and that is not the case. So, from this investigation we can see
that the parabola formed when the a value becomes zero is not tangent to this set of ellipses. The sequence of graphs formed as the value of a goes from 0 to 0.34 can be seen in the video below. |
 |