Nathan Wisdom
An investigation of the curve defined by the equation:
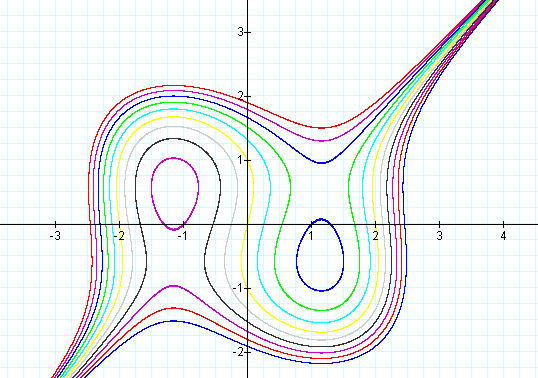
A graph of the equation is shown
What happens if the 4 is replaced by other numbers? The graph below
shows a set of curves that resulted when 4 is replaced by (5, 3,2, 1.1,
1, 0.0, -3):
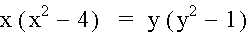
Note the case when the 4 is replaced with1. We get the following graph
It appears as if this graph is an intersection of the line y= x and an
ellipse of some form.Is is possible to form this equation by using an alternate equation? What would that equation be?
Consider the equation and the equation y = x on the same axes. could this be and alternate set of equations to graph the curve?
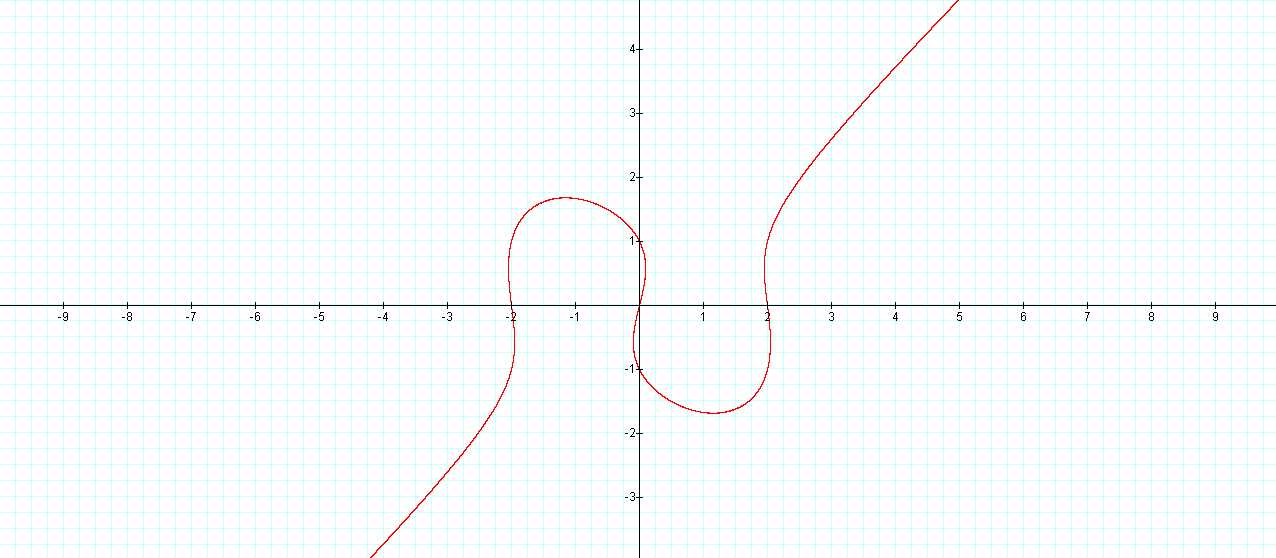
Note that if we add -2 to the left hand of the equation we get the
following graph for the equation
The following set of graphs shows what happens when the constant {5,4,3,2,1,0,-1,-2,-3,-4,-5} is added to one side of the equation. See the equations