
Constant or Not So Constant:
![]()
by
Priscilla Alexander
This
write-up is for students who are just being introduced to the graph of a
parabola. The student will see how the constants in the equation have an effect
on the graph of the equation.
A
parabolic equation is one whose highest exponent is
two. For example
![]() or
or ![]()
and
the graph looks like
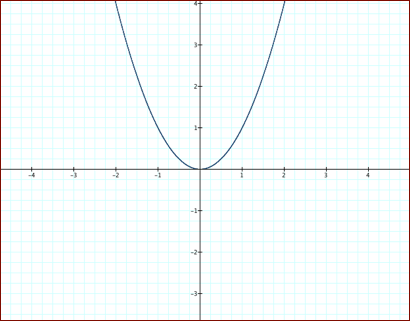
The
graph can look like a cup or an upside down cup with it vertex sometimes at the
y-axis. A vertex is the highest or lowest turning point of a parabola. A
constant is the value that ![]() ,
, ![]() , or
, or ![]() can take. Now
let us look at what the constants do to its graph.
can take. Now
let us look at what the constants do to its graph.
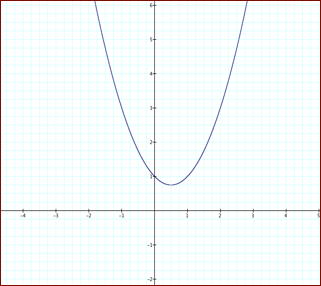
First,
let us hold ![]() and
and ![]() at one. Let us
give
at one. Let us
give ![]() the values (
the values (![]() ). So the equations are
). So the equations are

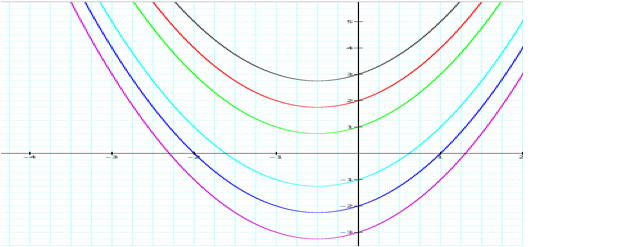
-3 takes the parabola with the color of purple, -2 takes the parabola with the color of blue,
-1 takes the parabola with the
color of light blue,1 takes the parabola with the color
of green,
2 takes the parabola with the color
of red
3 takes
the parabola with the color of black
From the graphs it can be seen that the constant ![]() determines the
values of the y intercept of the parabola.
determines the
values of the y intercept of the parabola.
Next let us hold ![]() and
and ![]() at one and
manipulate the constant
at one and
manipulate the constant ![]() . Let the values of
. Let the values of ![]() be
be ![]() . The equations are
. The equations are

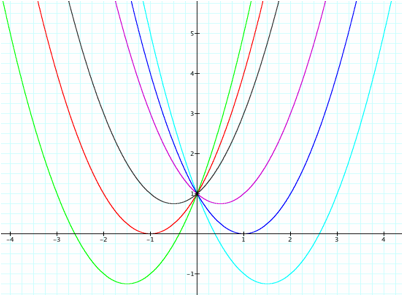
-1 takes the parabola with the color of purple
-2 takes the parabola with the
color of blue
-3 takes the parabola with the
color of light blue
3 takes
the parabola with the color of green
2 takes
the parabola with the color of red
1 takes the parabola with the
color of black
The values of ![]() makes the graphs
shift to the left or to the right. The negative values of
makes the graphs
shift to the left or to the right. The negative values of ![]() makes the graph
shift to the right and the positive values of
makes the graph
shift to the right and the positive values of ![]() makes the graph
shift to the left. The values of
makes the graph
shift to the left. The values of ![]() make the
parabola’s vertex shift ½ the value of
make the
parabola’s vertex shift ½ the value of ![]() to the
appropriate direction. Also, half the value of b is the x coordinate of the
vertex.
to the
appropriate direction. Also, half the value of b is the x coordinate of the
vertex.
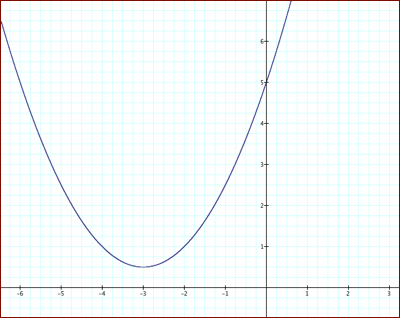
Thus far we see that ![]() is the value is
the y-intercept of the parabola. In addition, that ½ the value of
is the value is
the y-intercept of the parabola. In addition, that ½ the value of ![]() tells how many
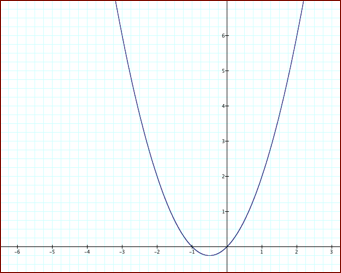
places to the left or to the right. So we can expect the graph of the equation
tells how many
places to the left or to the right. So we can expect the graph of the equation ![]() to intercept at
5, the vertex to shift to the left 1 unit, and. See graph.
to intercept at
5, the vertex to shift to the left 1 unit, and. See graph.

Third, let us hold ![]() and
and ![]() at the value one
and change
at the value one
and change ![]() . Let us make the values of
. Let us make the values of ![]() be
be
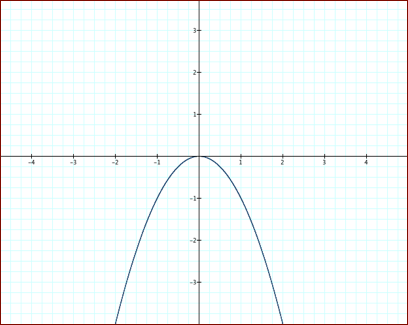
![]() . If the value of
. If the value of ![]() is negative, the
graph will open down. If the value of
is negative, the
graph will open down. If the value of ![]() is positive the
graph will open upward. See graph.
is positive the
graph will open upward. See graph.
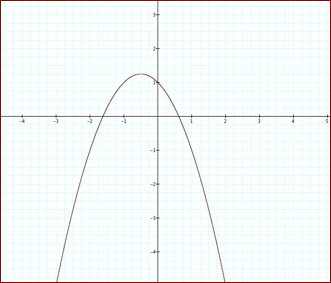
a is negative
a
is positive
When ![]() is a negative
number and when the value of
is a negative
number and when the value of ![]() is negative the
vertex shifts to the left and when
is negative the
vertex shifts to the left and when ![]() is positive the
vertex shifts to the right. See the above graph. When
is positive the
vertex shifts to the right. See the above graph. When ![]() is an integer
between 1 to infinity and -1 to infinity the graph shrinks.
As
is an integer
between 1 to infinity and -1 to infinity the graph shrinks.
As ![]() approaches zero
the graph gets wider. See the parabolas below.
approaches zero
the graph gets wider. See the parabolas below.

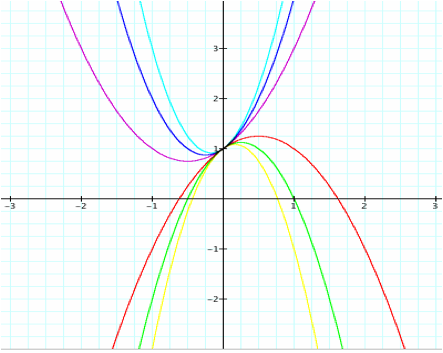
1 takes the parabola with the
color of purple
2 takes
the parabola with the color of blue
3 takes
the parabola with the color of light blue
-2 takes the parabola with the
color of green
-1 takes the parabola with the
color of red
-3 takes the parabola with the
color of yellow
Thus far we have seen that ![]() determines the
y-intercept of the graph,
determines the
y-intercept of the graph, ![]() determines how
far and which way the vertex shifts, and
determines how
far and which way the vertex shifts, and ![]() determines if
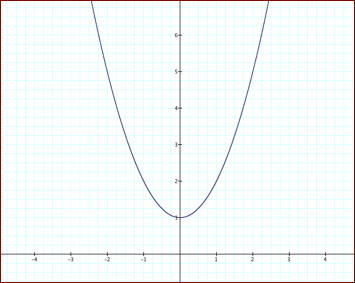
the graph opens up or down, and if the graph is wide or narrow. So we can
expect the equation
determines if
the graph opens up or down, and if the graph is wide or narrow. So we can
expect the equation ![]() to intercept at
the y-axis at 5, open upward, the vertex to shift to the left, and to be
extremely wide.
to intercept at
the y-axis at 5, open upward, the vertex to shift to the left, and to be
extremely wide.
Finally, the behavior of the graph![]() changes when
changes when ![]() ,
,![]() , or
, or ![]() is equal to
zero. When a value is not zero, we
assume it to be one.
is equal to
zero. When a value is not zero, we
assume it to be one.
1. When ![]() ,
,![]() , or
, or ![]() are all zero
there is no picture on the graph.
are all zero
there is no picture on the graph.
2. When ![]() is zero the
y-intercept of the graph is zero
is zero the
y-intercept of the graph is zero
3. When ![]() is zero, the
graph does not shift, it has a y-intercept at one.
is zero, the
graph does not shift, it has a y-intercept at one.
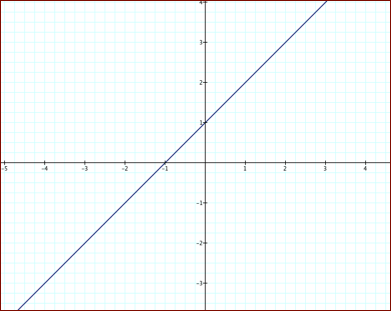
4. When ![]() is zero the
graph of the equation is a line with a negative or positive slope. The slope
depends on
is zero the
graph of the equation is a line with a negative or positive slope. The slope
depends on ![]() .
.
In
conclusion, we can see that the value of ![]() determines the
y-intercept. Next we saw that the values of
determines the
y-intercept. Next we saw that the values of ![]() determined if
the graph shifted to the left or to the right. Then we saw that
determined if
the graph shifted to the left or to the right. Then we saw that ![]() determined how
wide or how narrow the graph would be and
determined how
wide or how narrow the graph would be and ![]() determined if
the graph would open downward or upward. Finally we saw that zero was a special
value for
determined if
the graph would open downward or upward. Finally we saw that zero was a special
value for
![]() . The most special case is when the equation goes from a
parabola to a line. With all of the information given we can now determine if
the values of
. The most special case is when the equation goes from a
parabola to a line. With all of the information given we can now determine if
the values of ![]() ,
,![]() , or
, or ![]() make the
graphical behavior of the graph constant or not so constant.
make the
graphical behavior of the graph constant or not so constant.