
Parametric
Equations
By
Tonya
DeGeorge
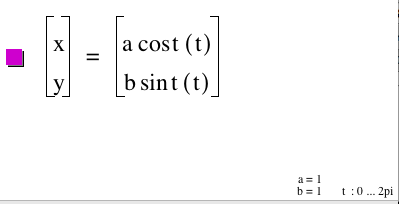
For this assignment, we are investigating the following:
![]() for
for ![]()
We want to know how the system changes as we change the values of a and b.
What do we get when a = b?
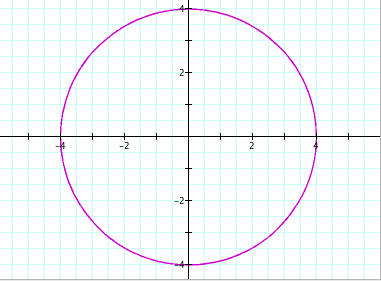
To begin this investigation, let’s look at a simple value of a and b: where both are equal to one. We get the following diagram:
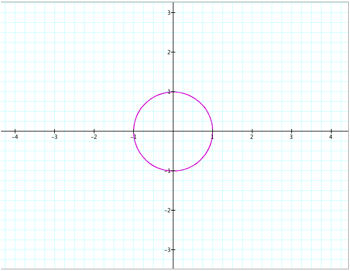
It seems that when the values of a and b are equal, we will get a circle. And in this case, we get a circle with a radius of one. However, does this change as we change the values of a and b? Suppose we look at different values of a and b, but still keep them equal. Let’s try the following:
Ø Positive values
o Very small positive values
o “Intermediate” positive
values
o Very large positive values
Ø Negative values
o Very small negative values
o “Intermediate” negative
values
o Very large negative values
(Note: when a = b = 0, the parametric equations equal zero and therefore this will not be investigated in this lesson).
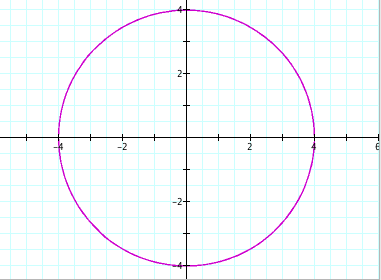
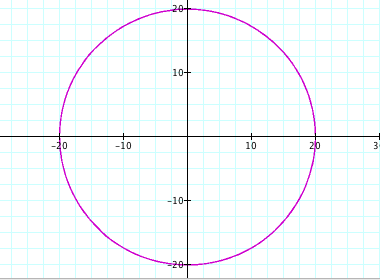
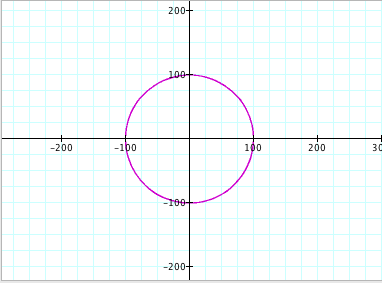
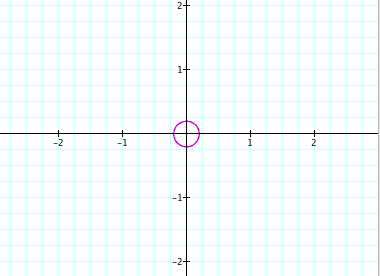
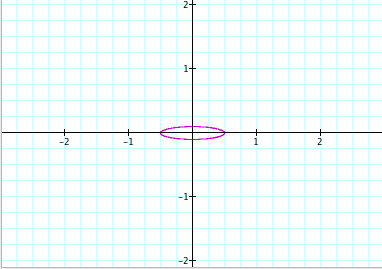
So let’s begin by looking at very small positive values. Although the number 1 is a small positive value, what would happen if we look at values of a and b smaller than one, but still greater than zero? Would the graph change? Let’s try a = b = 0.5:
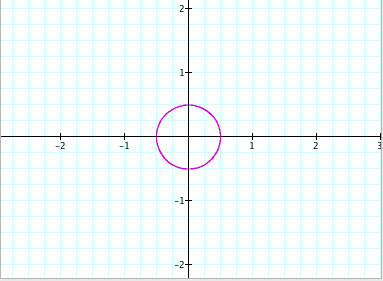 It appears that the circle
has shrunk, but now it has a radius of ½ - which is the value we gave a and b. So does this mean
that a and b affect the size of the circle? To check this, let’s look at all different values of a and b. To investigate
this, I chose the following values of a and b to look at:
It appears that the circle
has shrunk, but now it has a radius of ½ - which is the value we gave a and b. So does this mean
that a and b affect the size of the circle? To check this, let’s look at all different values of a and b. To investigate
this, I chose the following values of a and b to look at:
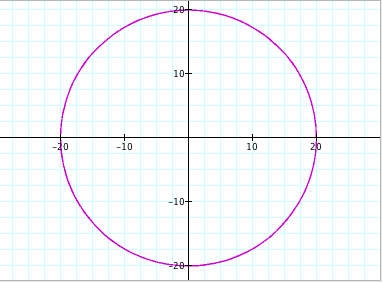
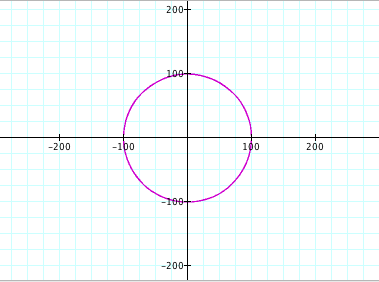
a) a = b = 0.2
b)
a = b = 4
c)
a = b = 20
d)
a = b = 100
e)
a = b = -0.2
f)
a =
b = -4
g)
a =
b = -20
h)
a =
b = -100
Take a look at the graphs below (please take note:
the scales of the graphs had to be changed in order to see the entire picture):
Positive values of a and b:
a) a = b = 0.2 b) a = b
= 4
c) a = b = 20
d) a = b = 100
e) a = b = -0.2 f)
a = b = -4
g) a = b = -20
h) a = b = -100
Conclusions (for when a = b):
It is clear from the graphs that when a = b, we will get a circle. The values of a and b determine the size of the circle that is drawn (with the center at the origin). We can also see that the radius of each circle is equal to the absolute value of a and b. For example, when a and b were -20, the radius of the circle was |-20| = 20.
Radius of Circle = |a| = |b|
What do we get when a < b?
Whenever we want to compare two values, there are different cases to consider:
·
a very small, b very small (i.e. a = 0.1, b = 0.5)
·
a very small, b “intermediate” value (i.e. a = 0.1, b = 4)
·
a very small, b very large (i.e. a = 0.1, b = 100)
·
a “intermediate” value, b very small (exclude because a must be less than b)
·
a “intermediate” value, b “intermediate” value (i.e. a = 4, b = 10)
·
a “intermediate” value, b very large (i.e. a = 4, b = 100)
·
a very large, b very small (exclude because a must be less than b)
·
a very large, b “intermediate value (exclude
because a must be less than b)
·
a very large, b very large (i.e. a = 100, b = 200)
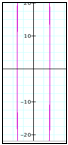
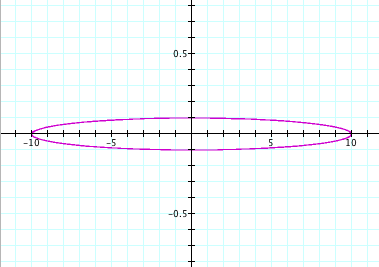
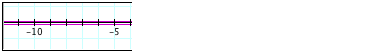
So let’s continue with the investigation. (Please note: some of the scales of the graphs had to be changed in order to see the entire picture. The original graph (before any scale changes) are in the bottom left corner of each graph).
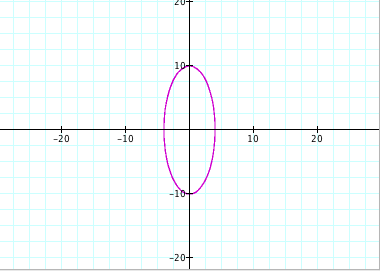
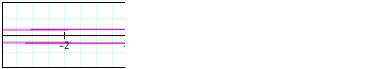
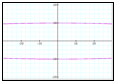
For a = 0.1, b = 0.5: For a = 0.1, b = 4:
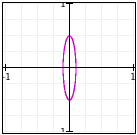
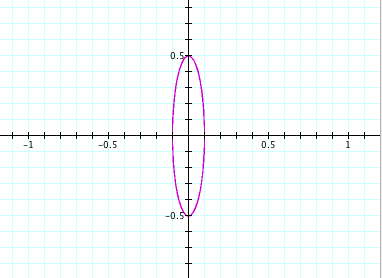
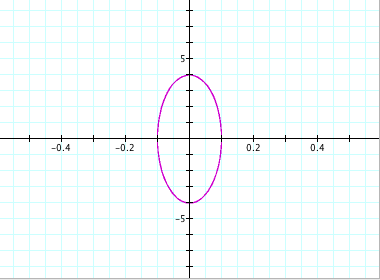
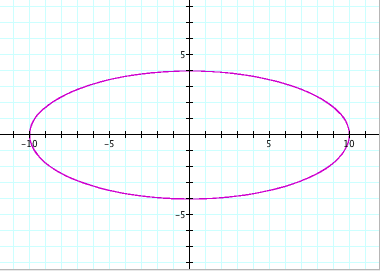
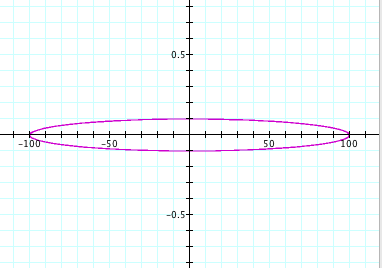
For a = 0.1, b = 100: For a = 4, b = 10:
![]()
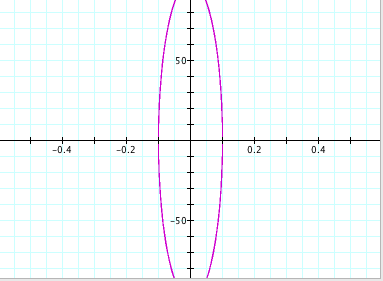
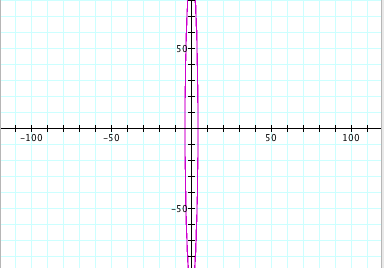
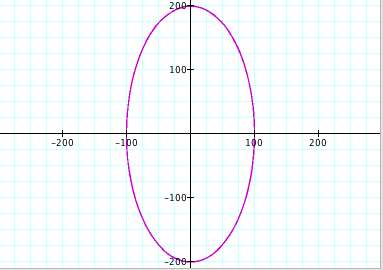
For a = 4, b = 100: For
a = 100, b = 200:
Conclusions (for when a < b):
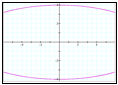
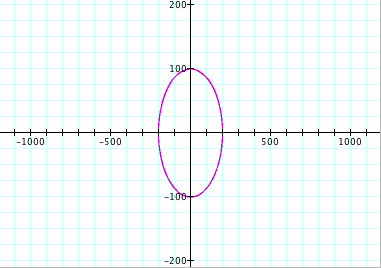
Clearly, we can see that we no longer get a circle. In fact, due to the values of a and b, the new shape appears to be an ellipse. From observation, we can see that the size of the ellipse is directly related to the values of a and b. For instance, when a = 100 and b = 200, we can see that the length of the ellipse along the y-axis is from -200 to 200 and the length of the ellipse along the x-axis is from -100 to 100. So it appears that the value of a controls the length along the x-axis and the value of b controls the length of the y-axis.
What do we get when a > b?
Again, whenever we want to compare two values, there are different cases to consider:
·
a very small, b very small (i.e. a = 0.5, b = 0.1)
·
a very small, b “intermediate” value (exclude
because b must be less than a)
·
a very small, b very large (exclude because b must be less than a)
·
a “intermediate” value, b very small (i.e. a = 10, b = 0.1)
·
a “intermediate” value, b “intermediate” value (i.e. a = 10, b = 4)
·
a “intermediate” value, b very large (exclude because b must be less than a)
·
a very large, b very small (i.e. a = 100, b = 0.1)
·
a very large, b “intermediate value (i.e. a = 100, b = 10)
·
a very large, b very large (i.e. a = 200, b = 100)
So let’s continue with the investigation. (Please note: some of the scales of the graphs had to be changed in order to see the entire picture. The original graph (before any scale changes) are shown on the bottom (or left corner) of each graph).
For a = 0.5, b = 0.1: For a = 10, b = 0.1:
For a = 10, b = 4: For a = 100, b = 0.1:
For a = 100, b = 10: For a = 200, b = 100:
Conclusions (for when a > b):
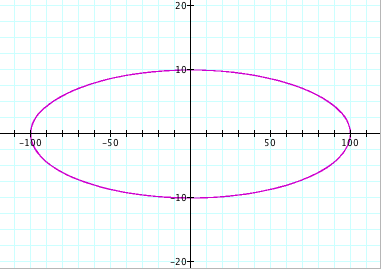
Again, we can see that we no longer get a circle. From observation, we can see that the size of the ellipse is directly related, again, to the values of a and b. For instance, when a = 200 and b = 100, we can see that the length of the ellipse along the y-axis is from -100 to 100 and the length of the ellipse along the x-axis is from -200 to 200. So this confirms that the value of a controls the length along the x-axis and the value of b controls the length of the y-axis.
Overall conclusions:
From this investigation, we have found the following:
Ø When the value of a is equal to the value of b, we get a circle with the center at
the origin.
o The size of the circle is
dependent upon the value of a and b.
o Radius of the circle = |a| = |b|
Ø When a < b or when a > b, the circle changes into an ellipse.
Ø The size of the ellipse
depends on the values of a and b:
o a determines
the length of the ellipse along the x-axis
(or 2a = length along x-axis)
o b determines
the length of the ellipse along the y-axis
(or 2b = length along y-axis)