
Polar
Equations
“N-Leaf
Rose”
by
Tonya
DeGeorge
In this investigation, we will be looking at two different functions:

where a and b are equal and n is an
integer
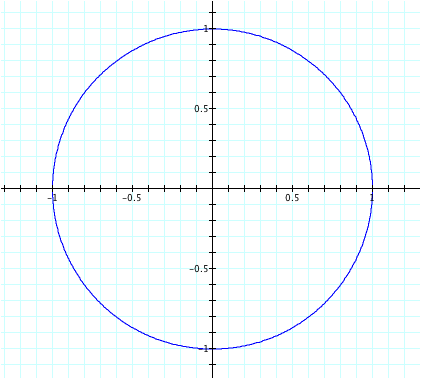
Let’s begin by looking at the first function. Let’s begin with a simple case, where a and b are equal to one and n is zero. The following is a graph that represents this function:
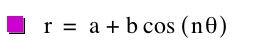
As we can see, when n is equal to zero, we get cos(0) which is equal to one. Hence we get a circle, where the radius is equal to two. Now let’s take a look at nontrivial cases.
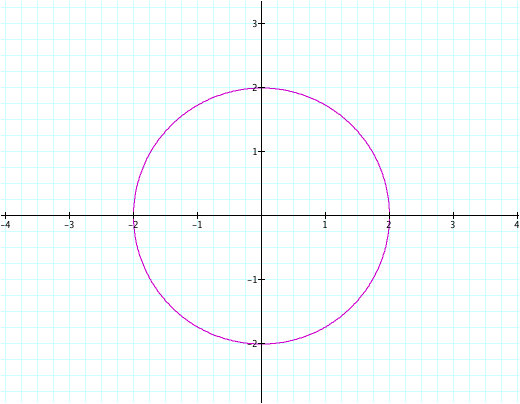
Suppose n is negative. What kind of picture do we get? Let’s begin with n = -10 (with a and b still equal to one):
What do you notice about this graph? It looks like the circle has turned into a “flower” with ten “petals.” Does this have anything to do with the value of n? Now let’s try n = -8 to see if we get eight “petals” in the next graph.
Again, it appears that the value of n determines the number of “petals” in the graph. Observe the graphs below (with corresponding n values).
n = -6 n = -4
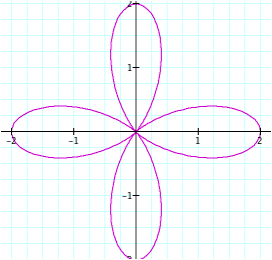
n = -2
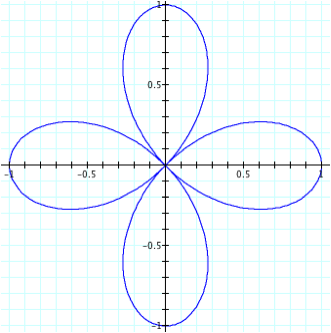
Now, this is interesting. Would we get the same type of graphs if we had used positive values of n? Let’s investigate this further. Observe the graphs below:
n = 2
n = 4
n = 6
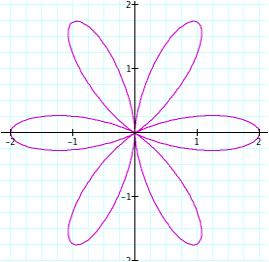
So it appears that the |n| determines the number of “petals” on the graph. The sign of n does not affect the graph (as long as n is even).
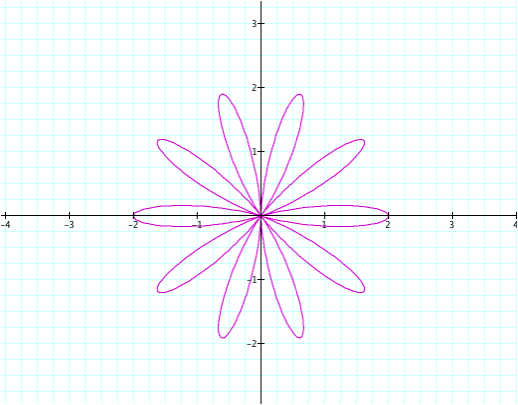
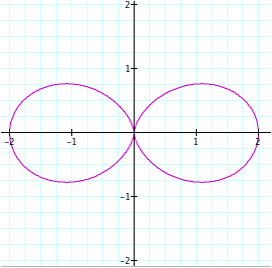
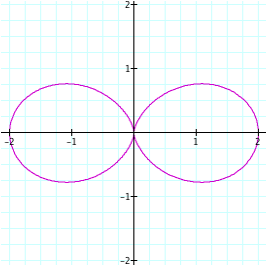
Did you notice that we chose all even values of n? Would this have changed if we chose an odd value? Let’s graph some odd values of n:
n = 1
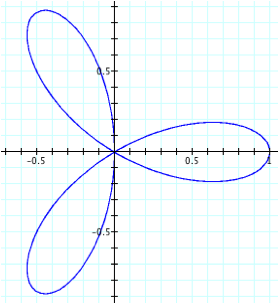
n = 3
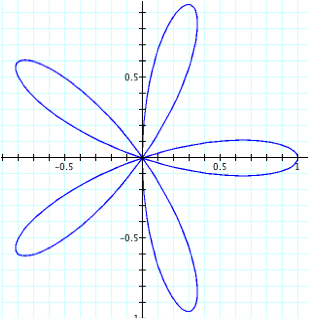
n = 5
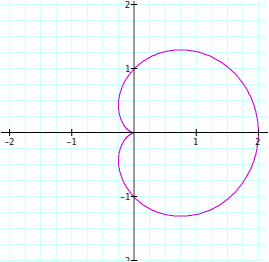
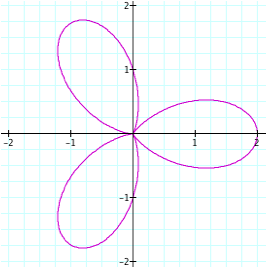
Now the problem becomes more interesting. It seems like at the value of n = 1, the graph is beginning to take on the shape of a flower (right now it resembles a lima bean). So essentially, this graph does have one “petal.” Likewise, the other graphs are still showing n number of “petals” (when n is three, there are three petals, etc.). However, although the other graphs look similar to the ones we saw earlier (for even values of n), there is something different about them. It looks as though the graph was rotated. In order to check if this is true, we will have to look at the graph in motion.
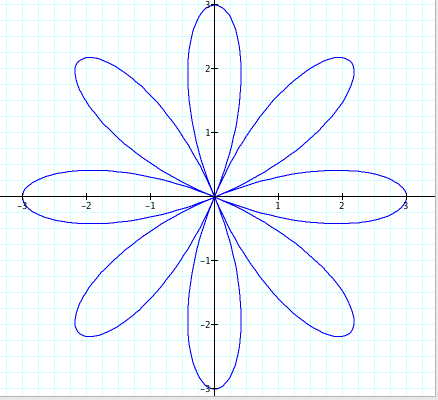
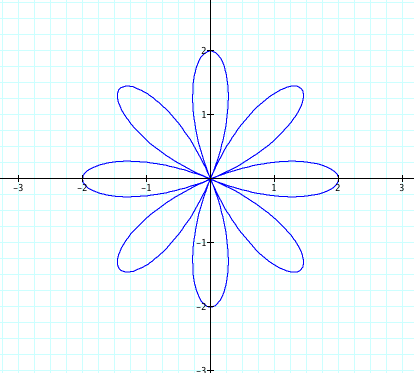
Now what if we change the values of a and b? We know only that a and b are equal, but what affect do these parameters have on the graph of the function? Let’s try different values of a and b (and when n = 4):
a = b = 3
a = b = 2
Conclusions:
Ø The number of “petals” of
the graph is determined by |n|
Ø If n is odd, the graph is rotated slightly to the right
Ø If n is zero, the graph is a circle with a radius equal to (a + b)
Ø The movement of the function
as n goes from -10 to 10 shows the
function starting at an initial value of 2 (when a and b were equal to
one) and creating the “petals” of the function
Ø a
and b changes the size of the graph
What if we took out the a term? How will the graph change? Let’s look at the other equation posted at the beginning of this page:
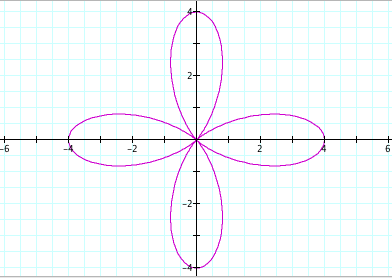
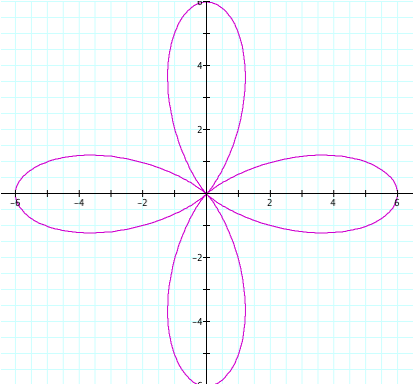
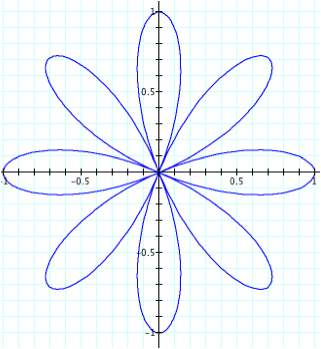
Let’s keep b = 1 and look at how the graph changes as we vary n first. Again, let’s begin with even values of n:
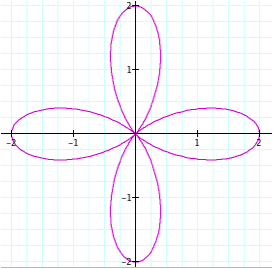
n = -2 n = -4
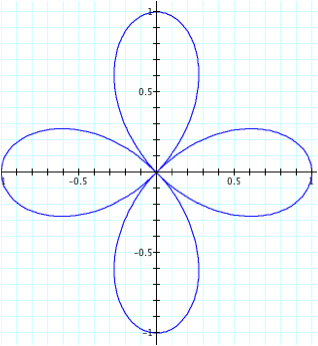
n = 2
n = 4
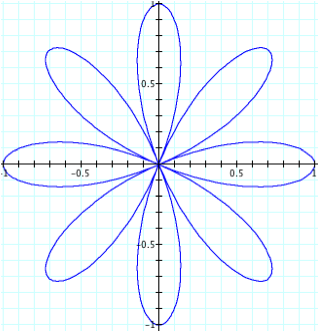
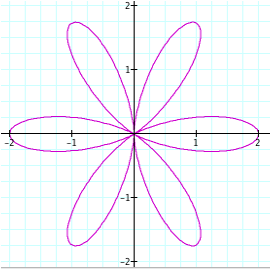
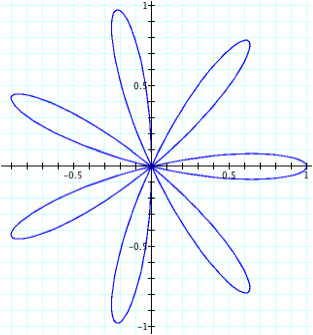
So although we get the same graph regardless of the sign of n, the number of “petals” is not dependent upon |n|. From the previous example, we would expect to get two “petals” but instead we get four. Likewise, we get eight “petals” when n is four. Hence, we can see that the number of “petals” in this case is dependent on |2n| or 2|n|.
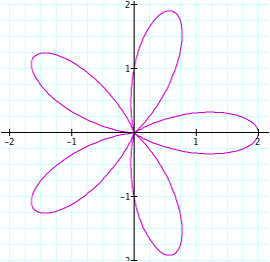
For odd values of n:
n = 3 n = 1
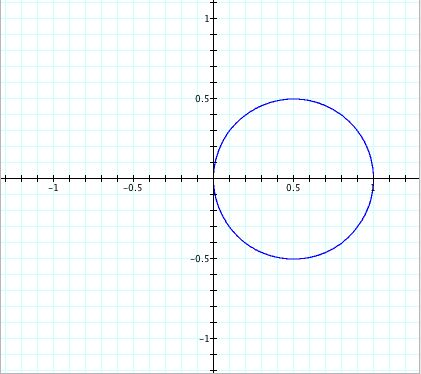
Take note that when n = 1, it does not look like a “lima bean” as the first function did. Instead it is a circle with a radius of ½ with it’s center at the point (1/2, 0).
n = 5
n = 7
Now it appears that we get the same type of rotation, but again, it would be better to view this in motion:
It is important to notice that the petals seem to rotate more with this graph than the first one we looked at.
Finally, let’s take a look at how the value of b affects the graph (for when n = 4).
b = 3
b = 3
Conclusions:
Ø The number of “petals” of
the graph is determined by |2n| or 2|n|
Ø If n is odd, the graph is rotated slightly to the right
Ø If n is zero, the graph is a circle with a radius b
Ø The movement of the function
as n goes from -10 to 10 shows the
function starting at an initial value of 1 (when b is equal to one) and creating the “petals” of the function
Ø b
changes the size of the graph