
An Investigation of the Sine Function
by
Tonya DeGeorge
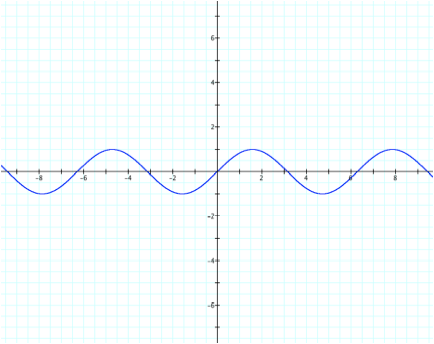
Let’s begin with the basic sine function: y = sinx
If we were to graph this function, we would get:
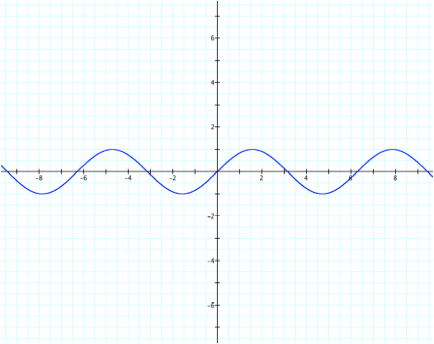
From this graph, we can see that the graph intersects the x-axis at 0,
, 2
For example, we can rewrite the function y = sinx as y = a sin(bx+c), where a, b, and c are real numbers. In this particular case, a and b are equal to one and c is equal to zero. In this investigation, we will see what happens to the sine function as we change values of a, b, and c.
What happens when
we change the value of a?
In order to see the difference, using the graphing calculator function, we should plot the function y = sinx and y = a sin(bx + c) on the same graph, changing the values of a while keeping b equal to one and c equal to 0.
Before plugging in different values of a, we should first consider all the possible values of a. Since a is a real number, there are three possible range of values: a can be greater to zero (a > 0), equal to zero (a = 0), or less than zero (a < 0). Let’s first investigate when a > 0.
What happens when a
> 0?
If we plug in 2 for a into the equation y = a sin(bx + c), we get y = 2sinx, as shown below:
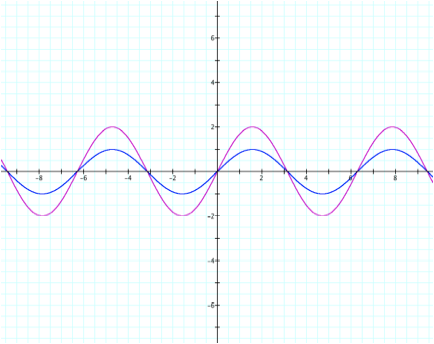
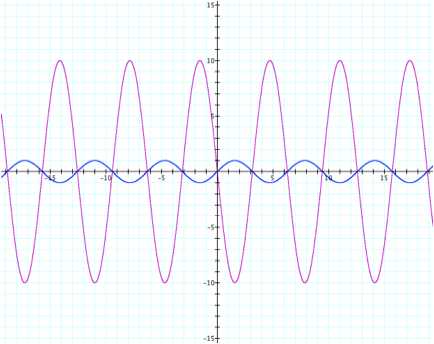
From this graph, we can see that when we change the a value to 2, the amplitude of the function increases. But does it work for any positive value of a? If we choose a different value, such as a = 10 (y = 10sinx), we get:
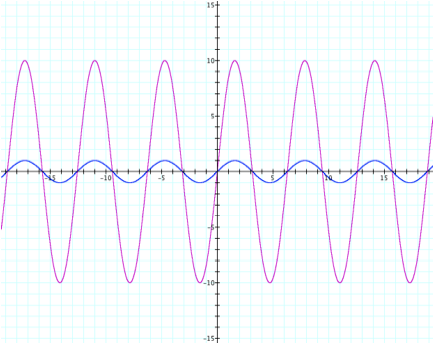
It would seem that whenever we change the value of a, the amplitude changes. However, if you take a closer look at the graph, we can see that the amplitude not only increases, but that it increases to the value of a. For a = 2, the amplitude increased to 2. For a = 10, the amplitude increased to 10. Therefore, we can assume, that for any positive value of a, the amplitude increases to that value.
What happens when a
= 0?
If we plug zero in for a, we can see that the function y = a sin(bx + c) becomes y = 0. Hence, the function is no longer a sine function and has become linear instead. The function y = 0 has a slope of zero and when graphed, it lies right on the x-axis.
What happens when a
< 0?
If we plug in -2 for a into the equation y = a sin(bx + c), we get the function y = -2sinx:
From here, we can see that the amplitude also increases to 2. Likewise, if we set a = -10, we see that the amplitude increases to 10:
Therefore, we can conclude that the amplitude of the function increases to |a|.
But what is the difference between a and –a?
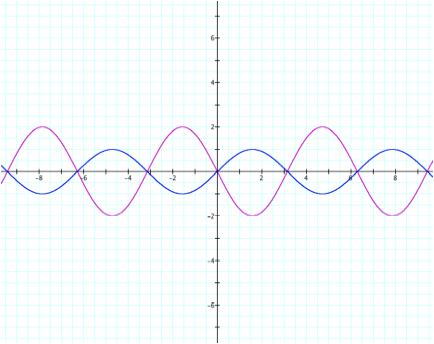
Now, you may be wondering what the difference is between plugging in a positive value of a and a negative value of a when the amplitude is changed to |a| in both cases. Well, let’s compare what happens to the graph when a = 2 and a = -2:
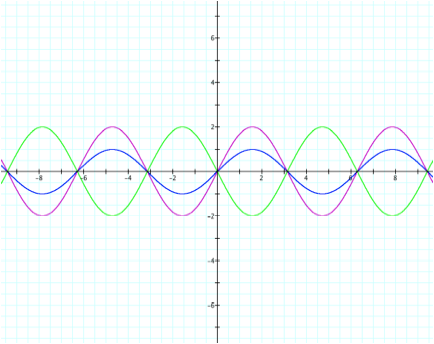
From this graph, we can see that the sign of a changes the graph. The purple line is the graph of the function y = 2sinx and the green line is the graph of the function y = -2sinx. We can see that when a is negative, it not only changes the amplitude of the function, but is also a reflection of the fucntion y = 2 sinx. We can also compare it for a = 10 and a = -10:
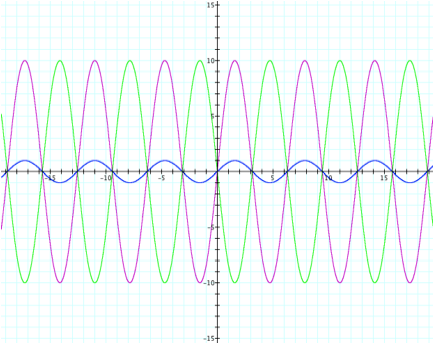
From here, we can see that we get the same results. (The purple line represents y = 10sinx and the green line represents y = -10sinx).
We can view the same findings when looking at the following animation, where a varies from -5 to 5:
Conclusions about the value of a:
* If a > 0, the amplitude of the function
changes to the value of a.
* If a < 0, the amplitude changes to the
value of |a| and is a reflection of
the function y = asinx.
* If a = 0, then the function changes to a
linear function, y = 0.
What happens when
we change the value of b?
As we did for the investigation of a, we will plot the function y = sinx and y = a sin(bx + c) on the same graph, changing the values of b while keeping a equal to one and c equal to 0.
Since b is a real number, there are three possible range of values: b can be greater to zero (b > 0), equal to zero (b = 0), or less than zero (b < 0). Let’s first investigate when b > 0.
What happens when b
> 0?
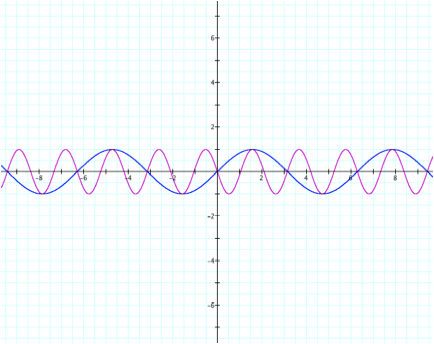
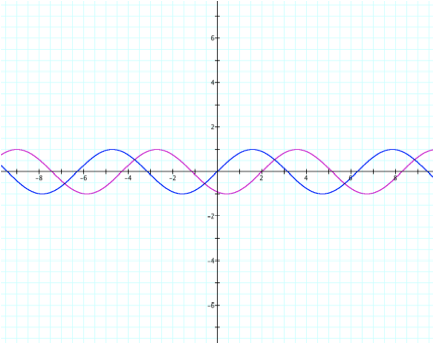
If we plug in 2 for b into the equation y = a sin(bx + c), we get y = sin(2x), as shown below:
From here, we can see that the graph of the function looks as though it has been compressed. So what exactly happened here? Well, if we take a look at the basic sine function again, we can see that the period of that function is 2
However, looking back at the previous graph:
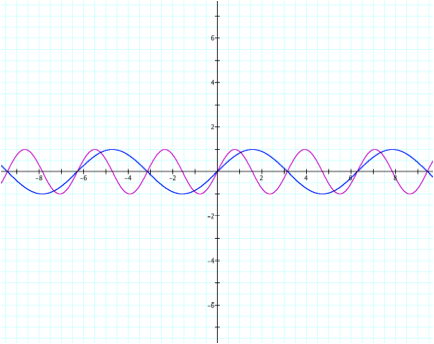
The period of the function y = sin2x is now
From here, we can see that there are now three complete waves in the same interval as one. But how can we express this in mathematical terms? So far, we have:
b = 1 -> y = sinx -> period: 2
b = 2 -> y = sin(2x) -> period:
)
b = 3 -> y = sin(3x) -> period:
(since three waves are in one period in comparison to the function y = sinx)
Therefore, for all positive values of b, we can conclude that the period of the function y = sinbx will be
.
What happens when b
= 0?
If we plug zero in for b, we can see that the function of y = sin(bx) becomes y = sin (0)x which then becomes y = sin(0). If we evaluate this, we can see that sin (0) is equal to 0 and therefore the equation becomes y = 0. So when b = 0, the function becomes linear.
What happens when b
< 0?
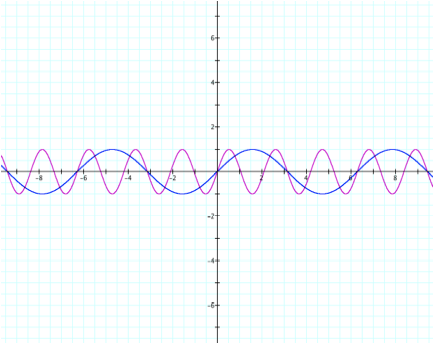
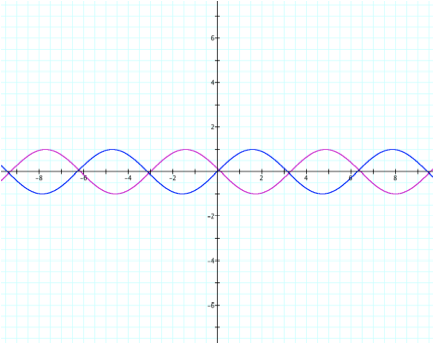
Let’s start by plugging in -2 for b (y = sin (-2x)) and see what we get:
By observing the graph, we can see that we obtain the same results: the period of the function changes. As in the case when b = 2, we can see that the period is now
Again, we see that the period has changed.
b = 1 -> y = sinx -> period: 2
b = -2 -> y = sin(-2x) -> period:
)
b = -3 -> y = 3sin(-3x) -> period:
(since three waves are in one period in comparison to the function y = sinx)
Therefore, for all negative values of b, we can conclude that the period of the function y = sin(bx) will be
.
But what is the difference between b and –b?
Again, you may be wondering what the difference is between plugging in a positive value of b and a negative value of b when the period is changed to
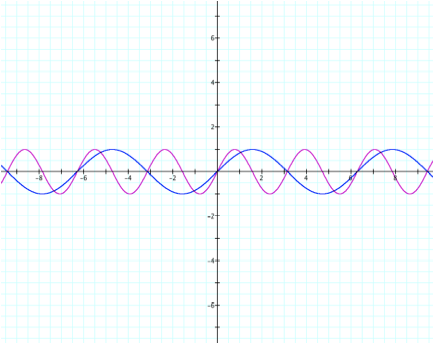
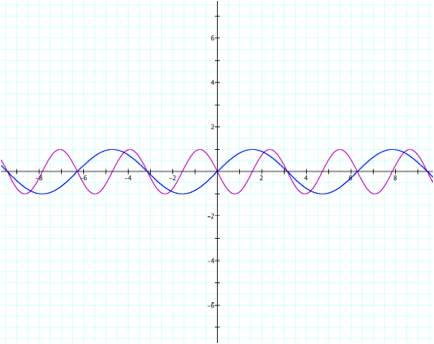
in both cases. Well, let’s compare what happens to the graph when b = 2 and b = -2:
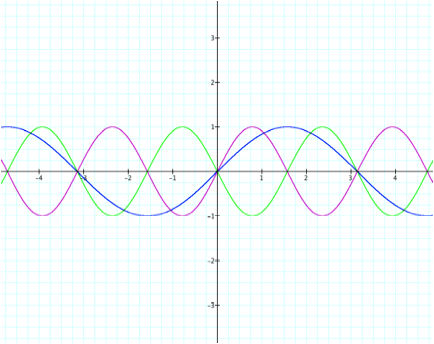
The purple represents the function y = sin2x and the green represents the function y = sin (-2x). From here we can see that they are reflections of each other. As in with the value of a, we can see that a negative value of b is the reflection of y = sin(bx), for when b is positive.
Conclusions about the value of b:
* If b > 0, the period of the function
changes to ![]() .
.
* If b < 0, the period of the function
changes to ![]() and is a reflection of the function y = sin(bx).
and is a reflection of the function y = sin(bx).
* If b = 0, then the function changes to a
linear function, y = sin (0), which
then becomes y = 0.
What happens when
we change the value of c?
Again, we will plot the function y = sinx and y = a sin(bx + c) on the same graph, changing the values of c while keeping a and b equal to one.
Since c is a real number, there are three possible range of values: c can be greater to zero (c > 0), equal to zero (c = 0), or less than zero (c < 0). Let’s first investigate when c > 0.
What happens when c
> 0?
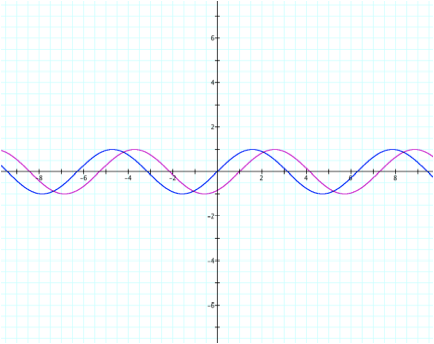
If we plug in 1 for c into the equation y = a sin(bx + c), we get y = sin (x + 1), as shown below:
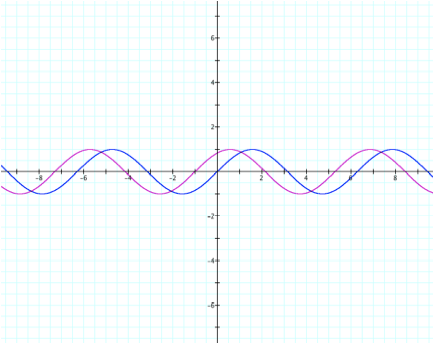
From here, we can see that the graph seems to have shifted to the left 1 unit value, with the amplitude and the period the same.
What happens if we change the value of c to 2 (y = sin (x + 2))?
Again, we can see that the graph shifted to the left, but this time it shifted two units. Likewise, we can see that it shifts three units when c = 3 (y = sin (x + 3)):
Therefore, we can conclude that the function y = sin (x +c) shifts to the left c units.
What happens when c
= 0?
If we plug in zero into the equation y = sin (x + c), we will get y = sinx. Therefore, when c = 0, the sine function does not shift in either direction.
What happens when c
< 0?
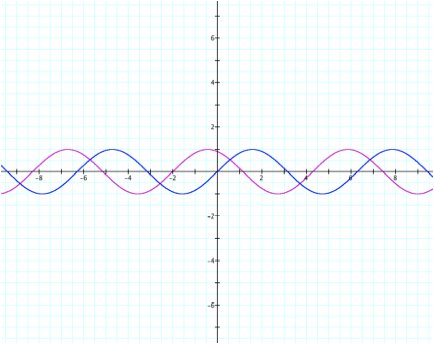
If we plug in -1 for c into the equation y = a sin(bx + c), we get y = sin (x – 1), which is shown below:
From here, we can see that the graph seems to have shifted to the right 1 unit value, with the amplitude and the period the same.
What happens if we change the value of c to -2 (y = sin (x - 2))?
Or for c = -3 (y = sin (x - 3))?
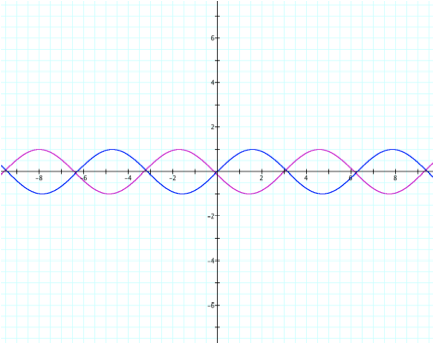
Therefore, we can conclude that the function y = sin (x + c) shifts to the right |c| units.
Again, we can see what happens as we vary c (ranging from -5 to 5) how the function changes in the animation below:
Conclusions about the value of c:
* If c > 0, the function shifts to the left c units.
* If c < 0, the function shifts to the
right |c| units.
* If c = 0, the function does not shift in
either direction. (When c = 0, the function stays as y = sinx)
Final Conclusion:
From this investigation, we have seen the sine function change depending on different values of a, b, and c. Let’s put all this information together:
For the given function: y = a sin (bx + c):
Ø When changing the value of a:
o If a > 0, the
amplitude of the function changes to the value of a.
o
If a < 0, the amplitude changes to the
value of |a| and is a reflection of
the function y = asinx.
o
If a = 0, then the function changes to a
linear function, y = 0.
Ø When changing the value of b:
o
If b > 0, the period of the function
changes to ![]() .
.
o
If b < 0, the period of the function
changes to ![]() and is a reflection of the function y = sin(bx).
and is a reflection of the function y = sin(bx).
o
If b = 0, then the function changes to a
linear function, y = sin (0), which
then becomes y = 0.
Ø When changing the value of c:
o If c > 0, the function shifts to the
left c units.
o If c < 0, the function shifts to the
right |c| units.
o If c = 0, the function does not shift in
either direction. (When c = 0, the function stays as y = sinx)