
How Does a Parabola Change Form?
by
Tonya
DeGeorge
Given the parabola in the form: ![]() , we would like to investigate what happens to the graph as
we vary one of the variables. In order
to do this, we need to hold two of the variables constant so we can vary only
one variable at a time.
, we would like to investigate what happens to the graph as
we vary one of the variables. In order
to do this, we need to hold two of the variables constant so we can vary only
one variable at a time.
Varying a:
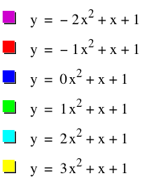
To begin, let’s vary a and set b and c equal to one. Therefore, the equation looks like:
![]()
Suppose we look at five different values of a: -2, -1, 0, 1, 2, 3 (these five values were chosen at random); what would the graph look like? Using Graphing Calculator, we can view all these graphs on the same coordinate plane:
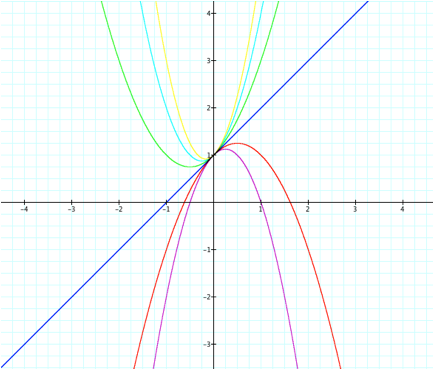
What conjectures can we make? Well, if we take a look at each value, we can see that negative values of a make the parabola look like is it opening downward and positive values of a looks like parabola is opening up. But what is the difference between the graphs of the function when a = -2 or when a = -1?
Well, if we observe the graph further, we can see that when a = -2, the parabola looks more “compact” than when a = -1. In other words, the “arms” of the parabola extend out further when the value of a becomes more positive (increases). However, it seems this does not hold true for when a > 0.
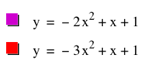
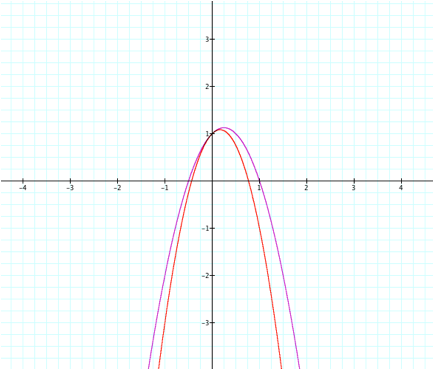
When we look at values 1, 2, and 3 for a, we can see that the “arms” of the parabola comes closer together as the value of a increases. So why do the “arms” come closer together at one part of the graph and go further apart on the other part of the graph as we increase the value of a? It is because we have to think about the absolute value of a. If we consider |a|, we can see that if we increase the value of a, the “arms” of the parabola come closer together. When we think about the negative values of a, we should be thinking about when the values of a get increasingly negative. To clarify, if a = -2 and a = -3, we can see that the “arms” of the parabola are closer together when a = -3 (because -3 is more negative than -2). We can see this in the graph below:
And when a = 0, the parabola turns into a line. (This is because when a = 0, the ![]() term is
eliminated and we are left with the equation:
term is
eliminated and we are left with the equation: ![]() , where, in this particular case, the slope and y-intercept
are both one.)
, where, in this particular case, the slope and y-intercept
are both one.)
Conclusions about varying the value of a:
Ø When a < 0, the parabola is concave down. As the value of a approaches zero (a becomes more positive), the “arms” of the parabola open up, moving further away from each other.
Ø
When a = 0, the quadratic function becomes a linear
function, with a slope of b and y-intercept of c.
(Since we started with the form: ![]() )
)
Ø When a > 0, the parabola is concave up. As the value of a increases, the ”arms” of the parabola come closer together.
When we move from negative values of a to positive values of a, the graph starts concave down, opens up and eventually becomes a line, and then flips to concave up, where the “arms” of the parabola come closer together. We can see this in the animation below:
Varying b:
Given this form: ![]() , we want to see what happens to the function when we vary b.
, we want to see what happens to the function when we vary b.
So, let’s vary b by keeping a and c equal to one:
![]()
Again, let’s look at five different values of b: -2, -1, 0, 1, 2, 3 (just to keep numbers consistent) and observe the graph below:
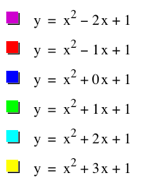
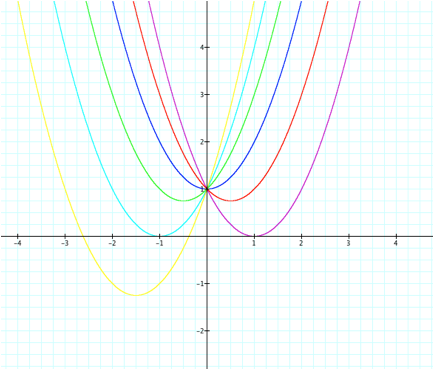
It is interesting to see that all the parabolas intersect at the same point: (0,1). Does this have any significance?
Well, let’s look at the animation below:
It looks as though the parabola is moving from right to left
as b
becomes more negative. However, it
seems to move around the point (0,1).
Could this be because we set the value of c to 1? Just to check and see if the graph changes, let’s change the
value of c
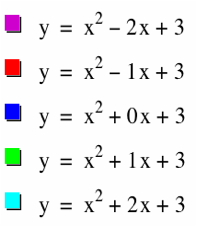
to 3. If we do that, we get: ![]()
Using the same set of values we have used for the value of b before
{-2,-1,0,1,2,3}, we get the following graph:
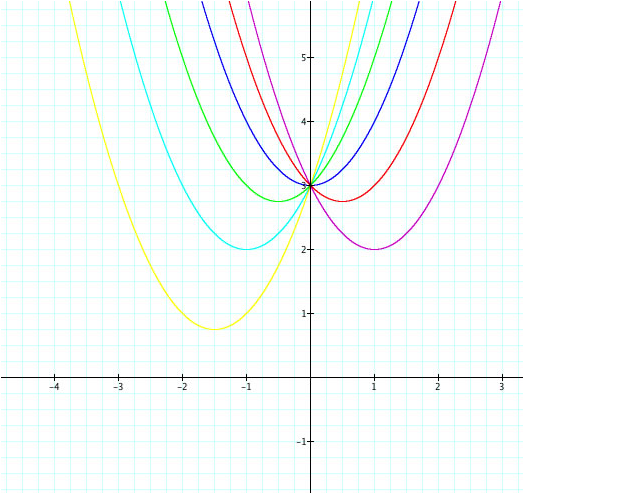
And animation:
We see the same thing happening in these graphs as well, except the function moves around the point (0,3). Since we have not investigated the value of c yet (although we have a pretty good idea what it does), the only thing we can say about the value of b is that it moves the function left or right, depending on the sign of the value of b. For example, when b is negative, we see the graph of the function is moved over to the right of the y-axis and as b gets increasingly more negative, the parabola is shifted downward (into the fourth quadrant). When b is positive, it moves the function to the left of the y-axis and as the value of b increases, the parabola is shifted downward (into the third quadrant). And finally, when b =0, the parabola has a minimum point at (0,c) and is directly centered on the coordinate plane. Thus, we can see that the minimum value never shifts up above the value of c.
Conclusions about varying the value of b:
Ø When b < 0, the parabola is moved to the right of the y-axis. As the value of b becomes more negative (increases negatively), the graph of the parabola is shifted downward into the fourth quadrant.
Ø When b = 0, the parabola is centered on the y-axis with it’s minimum point at (0,c).
Ø When b > 0, the parabola is moved to the left of the y-axis. As the value of b increases, the graph of the parabola is shifted downward into the third quadrant.
Varying c:
Given this form: ![]() , we want to see what happens to the function when we vary c.
, we want to see what happens to the function when we vary c.
So, let’s vary c by setting a = 1 and b = 0:
![]()
Again, let’s look at five different values of c: -2, -1, 0, 1, 2, 3 (keeping numbers consistent) and observe the graph below:
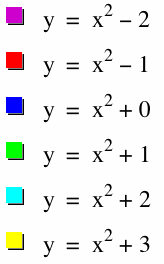
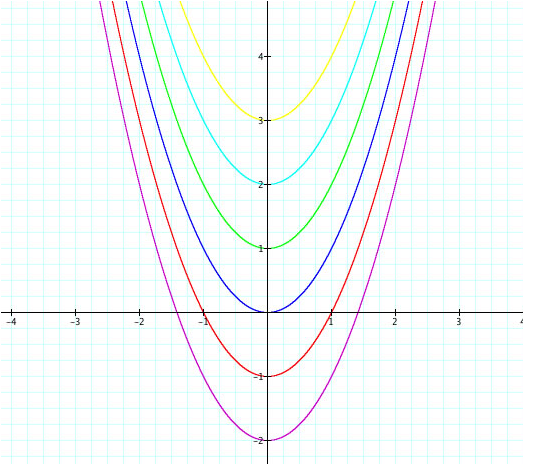
As we’ve hinted in the previous investigation (of b), we now see that the value of c can shift the parabola up or down depending on c. We can see this in the animation as well, shown below:
But where exactly does it shift the parabola?
Well, if we look at positive values of c, we can see that the graph is shifted upward and that the minimum point is always at (0,c). When c is negative, the parabola is shifted downward and the minimum point is still at (0,c) – but in this case c is negative. And when c = 0, the parabola has it’s minimum point at (0,0).
Conclusions about varying the value of c:
Ø When c < 0, the parabola is shifted downward c units.
Ø When c = 0, the parabola is not shifted in either direction and touches the x-axis.
Ø
When c > 0, the parabola is shifted upward c units.
Final Conclusion:
From this investigation, we have seen the quadratic function change depending on different values of a, b, and c. Let’s put all this information together:
For the given function: ![]()
When changing the value of a:
Ø When a < 0, the parabola is concave down. As the value of a approaches zero (a becomes more positive), the “arms” of the parabola open up, moving further away from each other.
Ø
When a = 0, the quadratic function becomes a linear
function, with a slope of b and y-intercept of c.
(Since we started with the form: ![]() )
)
Ø When a > 0, the parabola is concave up. As the value of a increases, the ”arms” of the parabola come closer together.
When changing the value of b:
Ø When b < 0, the parabola is moved to the right of the y-axis. As the value of b becomes more negative (increases negatively), the graph of the parabola is shifted downward into the fourth quadrant.
Ø When b = 0, the parabola is centered on the y-axis with it’s minimum point at (0,c).
Ø When b > 0, the parabola is moved to the left of the y-axis. As the value of b increases, the graph of the parabola is shifted downward into the third quadrant.
When changing the value of c:
Ø When c < 0, the parabola is shifted downward c units.
Ø When c = 0, the parabola is not shifted in either direction and touches the x-axis.
Ø
When c > 0, the parabola is shifted upward c units.