
Assignment 3: Problem 1
Jason P. Pickhardt
Problem:
Consider the equation in the xb plane:
![]()
Exploration:
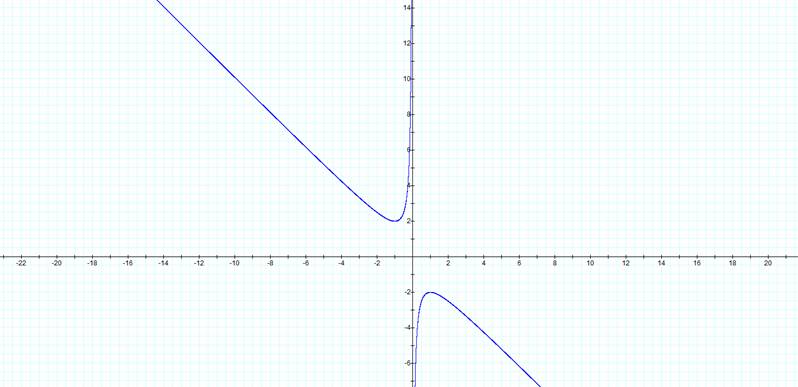
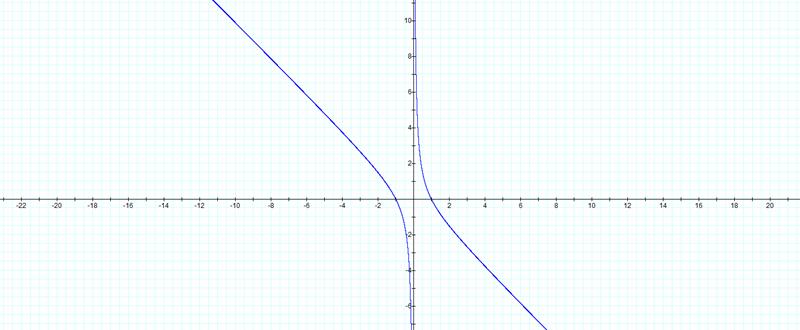
In order to graph the given equation in the xb plane we must first understand what the xb plane is. This is the case where are x-values are still on the horizontal axis and the b-values are on the vertical axis. The following picture is the graph of this equation in the xb plane. What results is a graph of a hyperbola that has two asymptotes. We can find these asymptotes by knowing that there are some values for which the given equation is false. This happens when:
x = 0, ![]()
b = -x, ![]()
Now we can graph different values of b for the equation. The following is an example of the equation for b = 3. The result is a horizontal line that crosses the original graph at two points. These represent two real roots for the original equation at the value b = 3.
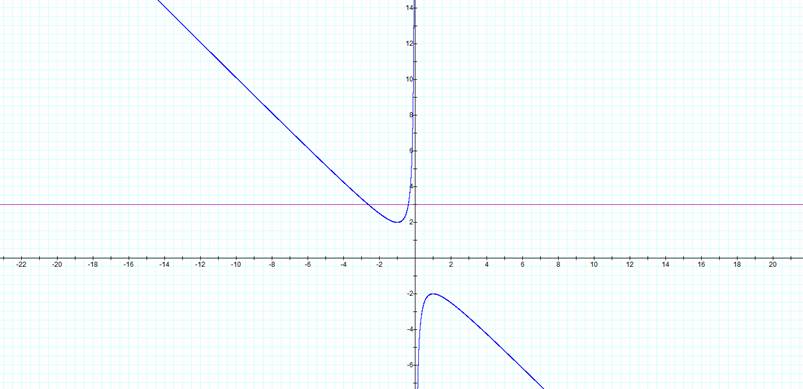
We can make a conjecture from this. Notice that for values of b from -2 < b < 2 there are no real solutions. When b > 2 we have two negative real solutions and when b < -2 there are two positive real solutions. Let’s see what happens when b = -2 and b = 2.
Hence, when b = -2, we have the positive real solution of x = 1. When b = 2, we have a negative real solution of x = -1. Another interesting thing to notice is what happens when we have the equation:
![]()
The new graph is a hyperbola. If we were to graph any value of b we would end up with two real solutions to the equation.
Conclusion:
When graphing the equation ![]() in the xb plane the
result is a hyperbola with asymptotes of x
= 0 and –x = b. Also, the equation has two real solutions for all values b > 2 and b < -2 and one real solution when b = -2 and b = 2. When -2
< b < 2 there are no real
solutions that satisfy the equation.
in the xb plane the
result is a hyperbola with asymptotes of x
= 0 and –x = b. Also, the equation has two real solutions for all values b > 2 and b < -2 and one real solution when b = -2 and b = 2. When -2
< b < 2 there are no real
solutions that satisfy the equation.