
To Infinity and Beyond
by
Mike Rosonet
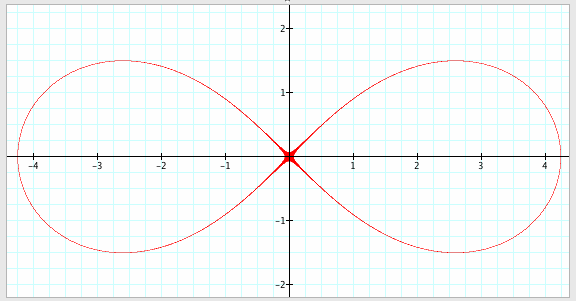
When the graph of the product of two distance equations are connected at a single point, the graph forms a lemniscate, which reveals the locus of a point's distances from two foci. The symbol for infinity is a lemniscate. Using coordinate geometry, given the points (a,0) and (-a,0), which are the foci, the center of the lemniscate will be located at the origin (0,0) and its major axis will be along the x-axis. Also, the distance between the two foci is 2a and the product of the two distance equations is a^(2).
For example, when a = 3, then the foci are located at (-3, 0) and (3, 0). The distance between them is 2a = 2(3) = 6, and the product of the two distances is a^(2) = 3^(2) = 9. Then,

will look like this:
Now, simplify the equation.
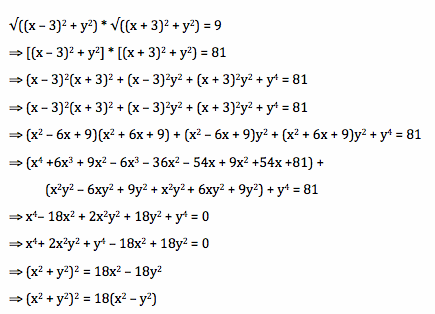
In a more general format, given that the foci of the lemniscate are (a,0) and (-a,0), then the equation in Cartesian coordinates is

where a^(2) is the product of a point's distances from the two foci.
View the graphs of the equation with different values for a.
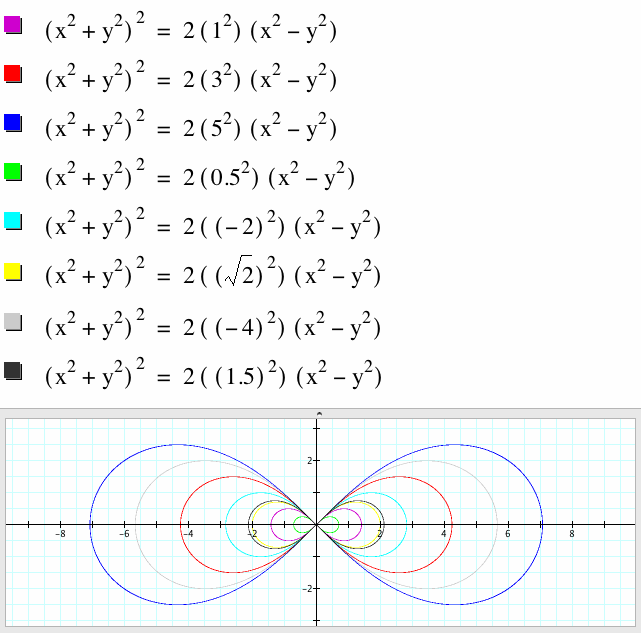
Furthermore, allowing the value of a to vary from -6 to 6:
Note that the graph of the equation when a = -6 is exactly the same as the graph of the equation when a = 6. This is because
.
Now, see what happens to the graph when the constant b is added to the right side of the cartesian equation. Thus, the equation and graph, when a = 1 = b, is
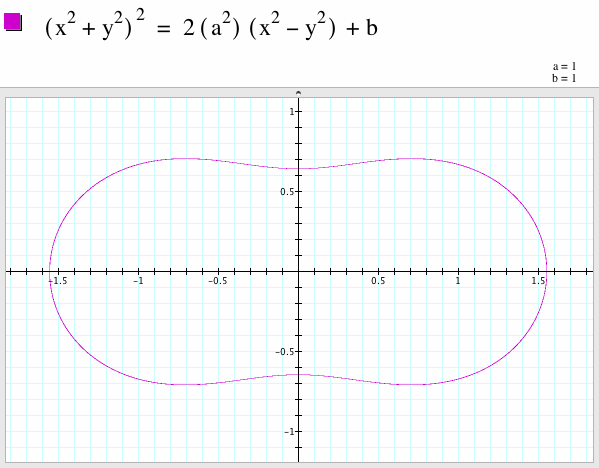
It looks like an overgrown peanut. Vary the value of a from a = -5 to a = 5 while maintaining b = 1 will look like this:
Note that, when a = 0, the graph is a circle. Also, as |a| increases, the distance between the left and right sides of the graph increase.
Also note that, when a = -5 and when a = 5, the two sides of the graph never meet at the center (0,0). Even when a = 100,000, the graph can be zoomed in so as to see that the two sides never meet at the center, as shown in this figure:
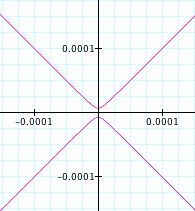
Now, vary the value of b from -1.1 to 8 while maintaining a = 1:
Note that, when b = 0, the graph is a lemniscate. When b = -1, the graph is two points, the foci. When b < -1, there is no graph. As b becomes greater, the distance between the top and bottom of the graph becomes greater, causing the graph to look like an egg.