![]()
Guitar String Hero
by
Mike Rosonet
Spreadsheet programs can be used in a myriad of ways to solve problems in mathematics. This page will use a spreadsheet to generate a function for a given data set.
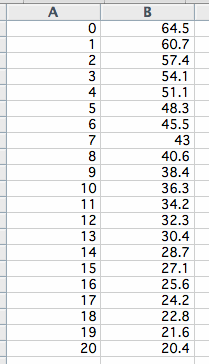
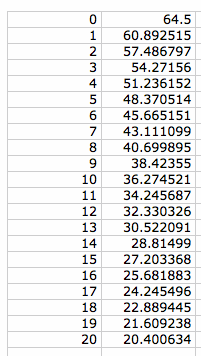
The following set of data was formed by measuring the length of a guitar string from a fret to the bridge of the guitar. Column A is the number of each fret with the open string as "fret 0." Column B is the length of the string from the given fret to the bridge; the initial measurement is the length of the open string. Then measurements were made for frets 1, 2, 3..., 22
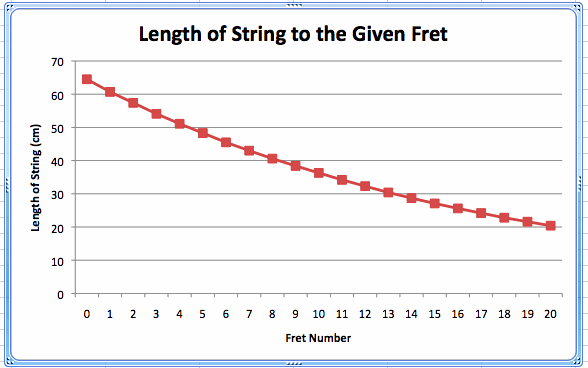
Now, graph the points using the spreadsheet program. The fret number is the x-coordinate and the length of the string is the y-coordinate.
This investigation will seek to write a function that produces this graph.
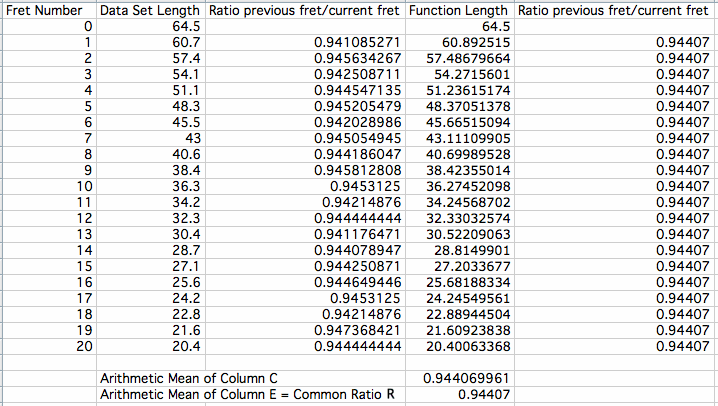
Begin by adding a column to the data set. This column will measure the ratio of successive cells. For example, cell C2 = B2/B1. Then, drag this down to the bottom of the data set, thereby performing this same operation for all successive cells in column B.
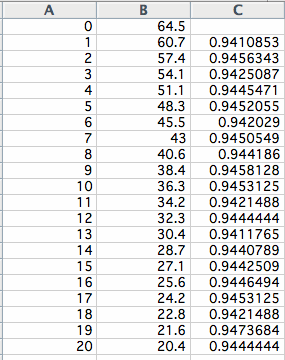
Observe that the ratios computed in Column C are all approximately the same. The ratio remaining constant is a characteristic of a linear function. Because the values in Column B are decreasing, the function is an exponential decay function. Thus, as shown in the graph above, the function looks like a curve with a downward direction.
Furthermore, by taking the arithmetic mean of the common ratio values in Column C, a better estimate of the ratio can be determined. Do this by using the average function in the spreadsheet program's math tools.
![]()
Thus, the arithmetic mean of the common ratios in column C, through the use of the average math tool, is 0.94407. Name this common ratio R.
Therefore, the initial value of the function is f(0) = 64.5, and the ratio R = 0.94407.
Using the exponential model equation,
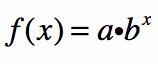
let a be the initial value of the function, f(0) = 64.5, and let b be the common ratio, R = 0.94407. Thus, the equation for the function is
![]()
Now, use this function to generate a list of lengths from 0 to 20 (again, the fret number with 0 being the length of the guitar string).
Comparing the given data set to the list of values found using the function,
Notice how close each length is to the other; the greatest difference is found between the length of the string from the bridge to the first fret. In the data set, that value is 60.7 cm., while, in the values found using the derived function, that value is 60.89 cm., approximately a difference of only 0.19 cm. Furthermore, notice that the difference between the arithmetic means of the ratios is 0.0000001 cm. Thus, the function is a best-fit model for the given data set.
This can also be seen in the graphs of the data set and the function.
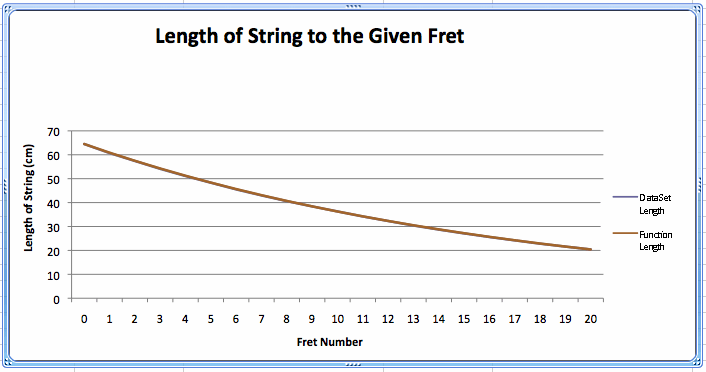
The graphs of the data set and the function are so close, in fact, that they cannot both be seen in the graph. This was shown algebraically in the difference between the common ratios, a negligible difference of 0.0000001 cm.
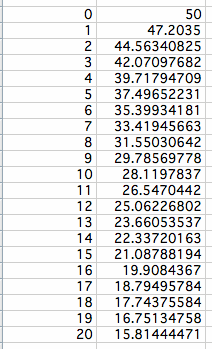
The question was posed: "How will the graph change if the instrument has a shorter neck? For instance, what if the length of the string is 50 cm?
If the length of the string is shortened, then the value of a would decrease from 64.5 to 50. Thus, the function would be
![]()
Like before, use the function to generate a list of values. Assume that there are 20 frets on this shortened neck.
Now, compare these values to those of the original function.
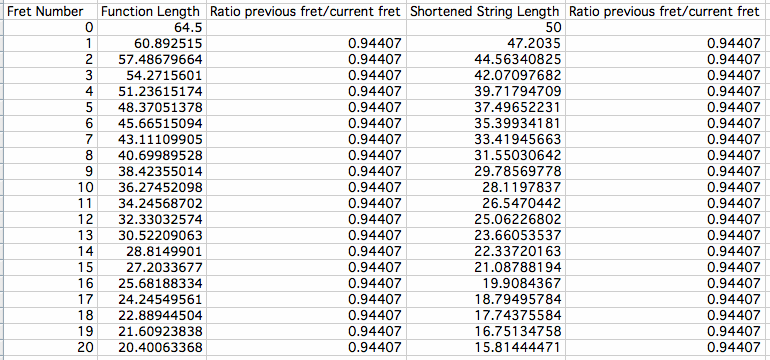
Notice that the difference between the function lengths and the shortened string lengths decrease as the distance from the bridge to the fret decreases. With the lengths of the string, the difference is 64.5 -- 50 = 14.5 cm. However, with the distance from the bridge to the 20th fret, the difference is 20.40063368 -- 15.81444471 = 4.58618897. Also, notice that the ratios between the frets are the exact same.
Comparing the graphs,
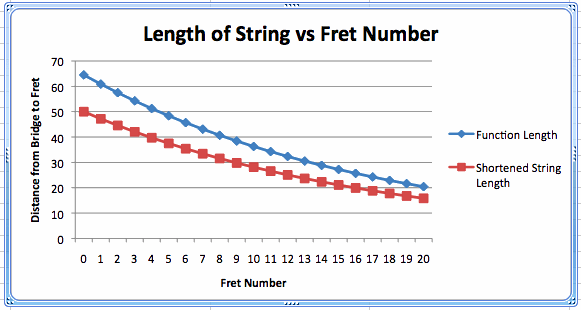
it is clear that decreasing the length of the string shifts the graph down. This is due to fact that the value of a in the shortened string graph is less than the value of a in the function graph. This also explains why the line representing the shortened string does not decay as quickly as the line representing the function; the greater the constant of decay, the quicker the decay.