
Exploring Tree Data
By: Brandie Thrasher
Lets investigate some data. We are given
information in regards to lumber. Our table shows the approximate number of
board feet of lumber per tree in the forest at the given age.
Tree Data
|
20 |
1 |
|
40 |
6 |
|
60 |
|
|
80 |
33 |
|
100 |
56 |
|
120 |
88 |
|
140 |
|
|
160 |
182 |
|
180 |
|
|
200 |
320 |
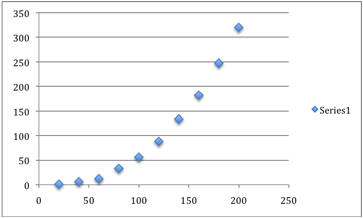
It appears that there is information missing for
ages 60, 140 and 180. We can try to find the data that goes there by plotting
the data and finding a line that best fits (or represents) the data. Lets see
what the data we have looks like in a graph (using Excel).
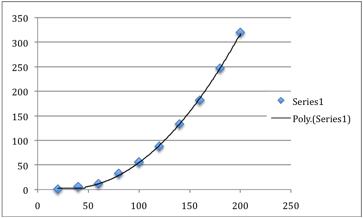
Using Excel, we can take the graph and apply a
line that can appear to fit the data the best. This is called adding a Trend
Line.
Now having a trend line, we can ask the program
to calculate the equation of our line.
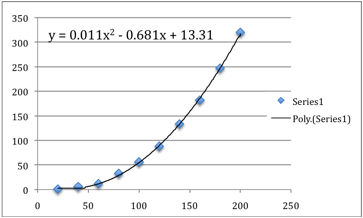
Using this equation, we can try to calculate the
missing values in our table.
|
20 |
1 |
|
40 |
6 |
|
60 |
12.05 |
|
80 |
33 |
|
100 |
56 |
|
120 |
88 |
|
140 |
133.57 |
|
160 |
182 |
|
180 |
247.13 |
|
200 |
320 |
Even though we found the missing data, our
equation may not be as perfect as we suspect. We can take a look at the
residuals (the amount of deviation from our given data and data found using the
equation) of our data and take a look at its graph. We want our deviations to
be close to zero, but we also want them to be random, showing that our equation
found IS the “best fit”.
|
20 |
1 |
4.09 |
3.09 |
|
40 |
6 |
3.67 |
-2.33 |
|
60 |
12.05 |
12.05 |
0 |
|
80 |
33 |
29.23 |
-3.77 |
|
100 |
56 |
55.21 |
-0.79 |
|
120 |
88 |
89.99 |
1.99 |
|
140 |
133.57 |
133.57 |
0 |
|
160 |
182 |
185.95 |
3.95 |
|
180 |
247.13 |
247.13 |
0 |
|
200 |
320 |
317.11 |
-2.89 |
The data in green represents the values obtained
using the equation found by graphing the points. The data in orange represents
the residuals. Are values are zero, where we used the equation to find the
missing values. We can now graph the residuals against the original age.
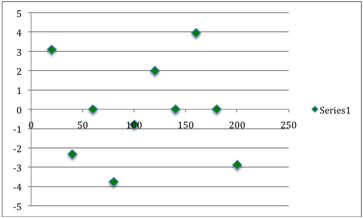
It appears that our graph of residuals fits our
criteria of appearing random and is close to zero. There are no real outliers
and no apparent pattern, so we can say that our equation y = 0.011x2
– 0.681x + 13.31 is our best-fit equation to represent our data!