

exploring exponential functions
by Patty Wagner
The exponential function is one of the few functions whose graph is recognized by many non-mathematicians. Having practical application in real-world areas such as finance, science, and even population growth has made "exponential" a common word in the English language. But how much is actually understood about this function? What implications can be uncovered through mathematical understanding of this function? And how can we impress upon the students in our classroom the value and importance of its use? Let's explore these questions by looking at one particular exponential function: that with base e.
First, some background information about the number e. Early mathematical work tended to focus on logarithms, and although the natural log (base e) is fairly well-known now, the number we know as e managed to escape the attention of mathematicians for many years. Many early mathematical explorers and scientists danced around the discovery, coming very close to uncovering it only to move away from it by some other distracting aspect of their work. Consequently, e did not burst into the mathematical world by some significant understanding (like that of π), but rather slowly emerged onto the scene through random dabblings into the nature of things such as finance. Why is e important? Because y = ex is the only equation known to man whose derivative is itself!
If you would like more information about the history of e and the exponential function, read "e: The Story of a Number" by Eli Maor. Click here to see the actual number e to 10,000 digits!
Now let's focus on the actual graph of the basic exponential function, y = ex

As you can see, the significant characteristic of this type of function is its slow initial growth leading to rapid increase. Students can form a connection with what they see here by considering the following analogy:
Suppose you make a deal with your parents that rather than take your regular monthly allowance of $50, you will accept just $.01 on the first day of the month and so on, with the condition that they double the amount they give you each day. Your parents rapidly figure out that in one week they will have given you just $1.25 ($0.01 + $0.02 + $0.04 + $0.08 + $0.16 + $0.32 + $0.64) so they agree. Will you get more than $50 that month? If so, on what day of the month will you have exceeded $50? Can you figure out how much money they will owe you on the last day of the month? (Assume there are 30 days in the month.)
You may want to point out that in this analogy we are looking at an exponential function with base 2. The function we are exploring has a base of e but the shape of the graph is similar. Here is a graph of y = 2x so students can compare:

Now that students have a general appreciation for the function, we can let them explore some characteristics. Let's see what happens when we add some constant to the function.
Ask students to guess what y = ex + 10 would look like. Have students create a scenario related to the money analogy. (Such as adding some amount, like $0.50 to each day.) Can they see why it would make a big difference at the beginning but become less important as x becomes larger? Have them relate this understanding to what they see in the graph.
What if we multiply some constant to our function?
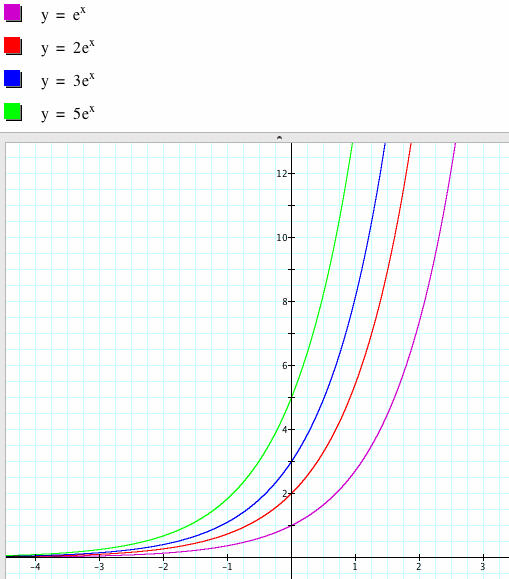
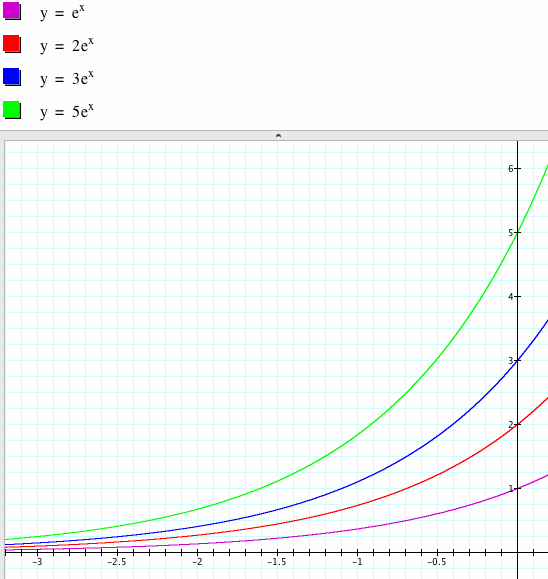
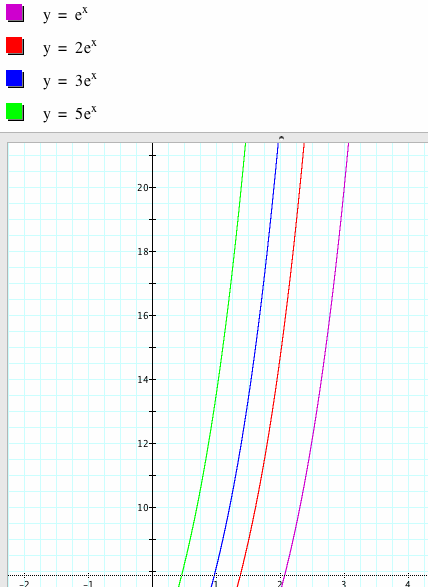
You can use the above graphs to look closely at the various aspects. What effect does multiplication have on the y-intercept? Does multiplying change the smallest number y that the graph approaches when x becomes more and more negative? Does it look like the lines will come together at any point as x becomes larger? Have the students consider the graphs with their understanding of the money analogy. This would be like multiplying what they were to receive each day by some amount. Have students make the connection between the day, x, and how much they earn. Does the graph support the idea that it is a good idea to multiply by some amount greater than 1? Have students consider what the graph would look like if we multiplied by some number between 0 and 1.
We can introduce the idea of differing the values of the exponent in our function by having the students continue with their money analogy. Ask them to think about multiplying some number greater than one to the amount they are to receive each day, just as they had done previously. Now ask them to consider the special case where the amount they are multiplying is 2. Students should see that this is the same as "pushing up" the amount by one day. In other words, if they were to receive $0.01 on day one and $0.02 on day two, then multiplying the amount they are supposed to get on day one by 2 gives them the amount they were supposed to get on day two. They should be able to see that this will be the case for every day. So, multiplying by 2 is the same as changing the day from x to x+1! Have them theorize a different way they can write the equation y = e(ex).
We can have the students check their theory by graphing the equations:
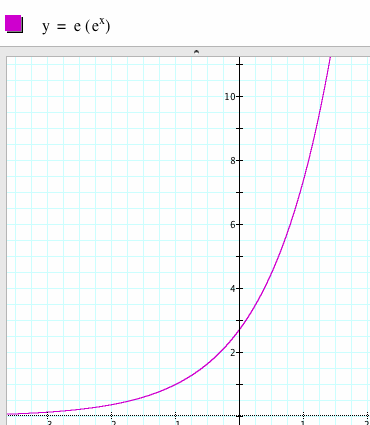
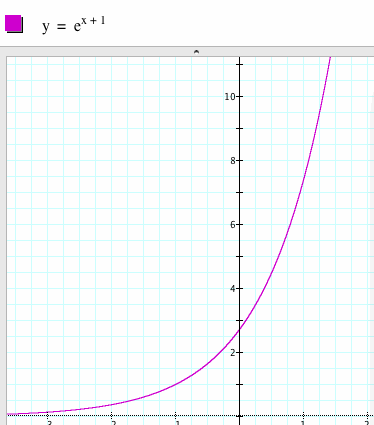
Challenge the students to use what they just learned to predict the graphs of y = ex+n. Have them consider when n = x. What do they know about this special case?
Hopefully, after working through this exercise, your students will be more comfortable with the exponential function, even when it involves a base that isn't intuitive to them. They may have developed an appreciation for this type of function with their exploration of just one application. You may want to show them a few more real life applications of this amazing function or have them research it on their own.
Reference
Maor, E. (1998). e: the story of a number. Princeton, NJ: Princeton University Press
Return to Patty Wagner's homepage