![]()
Twisted Functions
by
Patty Wagner
In this write-up I will explore parametric equations and consider the concept behind them. Parametric equations are functions with a fun twist. Consider the functions:
x = cos t and y = sin t
If we allow these two functions to define our points (x,y) at a particular value, t, then we see what occurs when we change the value of t. Since we are working with cosine and sine, it makes sense to allow our values for t to range froms 0 ≤ t ≤ 2π.
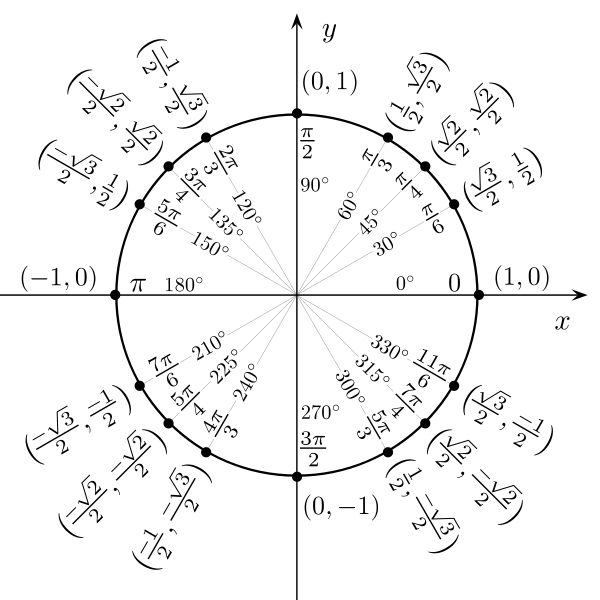
You may recognize this as the unit circle. You can graph it by putting in specific values for t and connecting the resulting points. For example, when
t = 0, x = 1 and y = 0 and the resulting point is (1,0).
Here is a unit circle with well know values for t plotted:
One of the fun things that can be done with parametric equations is the graphing of three dimensional curves. In reality we live in 3-dimensional space. So it's helpful to consider the graph above as
x = cos t, y = sin t, and z = 0.
What happens if we assign a value to z different from zero? You may immediately realize that you just end up with your two-dimensional circle "raised" or "lowered" to a different plane perpendicular to z. The interesting stuff happens when you let z vary, such as when z = t.
These graphs show what happens when t ranges from about 0 to 50. We know that we get a unit circle as t moves from 0 to 2π. The circle also moves linearly up the z-axis as the circle is created. We can tell that t ranges from zero to about 50 since there are approximately 8 circles and
8(2π) ≈ 50
Going back to 2-dimensional space (to keep things simple), let's consider what happens when we place coefficients into our functions:
x = a cos t and y = b sin t
To the right we see
x = 2 cos t and y = sin t
It appears that the unit circle has been "stretched" along the x-axis and the range of x is now -2 ≤ x ≤ 2. This makes sense since we know that the range of
cos t when t varies from 0 to 2π is -1 to 1.
Obviously, 2 cos t will give us a range that is -2 to 2.
Using what we know about the range of sine and cosine, we can predict that if we let b = 2 in the above equation for y, we will get a unit circle "stretched" along the y-axis, with y values ranging from -2 to 2. If we let a = 1, then we'll get an elliptical figure like the one above except stretched along the y-axis:
This leads us to conjecture that we will get a circle when a = b. Here is a graph of
x = 5 cos t and y = 5 sin t
It appears that we've exhausted all that could be of interest in this case. However, there's one thing we haven't considered yet. What if a = b = t? We would have
x = t cos t and y = t sin t
This is a special case of a = b where the graph doesn't produce a circle. We can see what is happening by considering a series of circles of the form
x = a cos t and y = a cos t
where a increases linearly. As, (x,y) moves around the circle, the circles gradually get larger in diameter.
We can see that the graph crosses the x-axis for the first time at -3.14 and crosses for the second time at x = 2π ≈ 6.28 which is what we would expect.
This elegant sprial is called "Archimedes's Spiral" and you can learn more about it here:
Return to Patty Wagner's home page